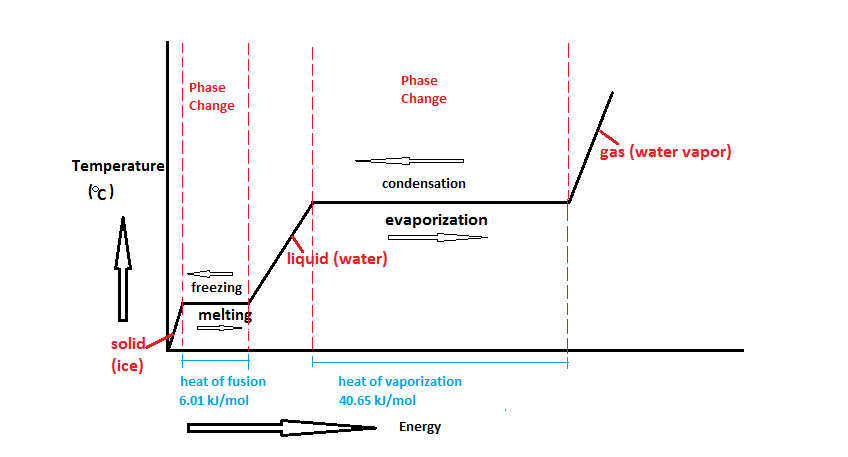
The relationships of between heat and phase change. The phase changes represent changes in latent heat. Changes in temperature represent changes in sensible heat.

The principal cause of differential heating on the Earth. A high angle of incidence near the Earth's equator means the suns energy is most concentrated per area there. In high latitudes, the low angle of incidence means the same amount of energy is spread out over a larger area.
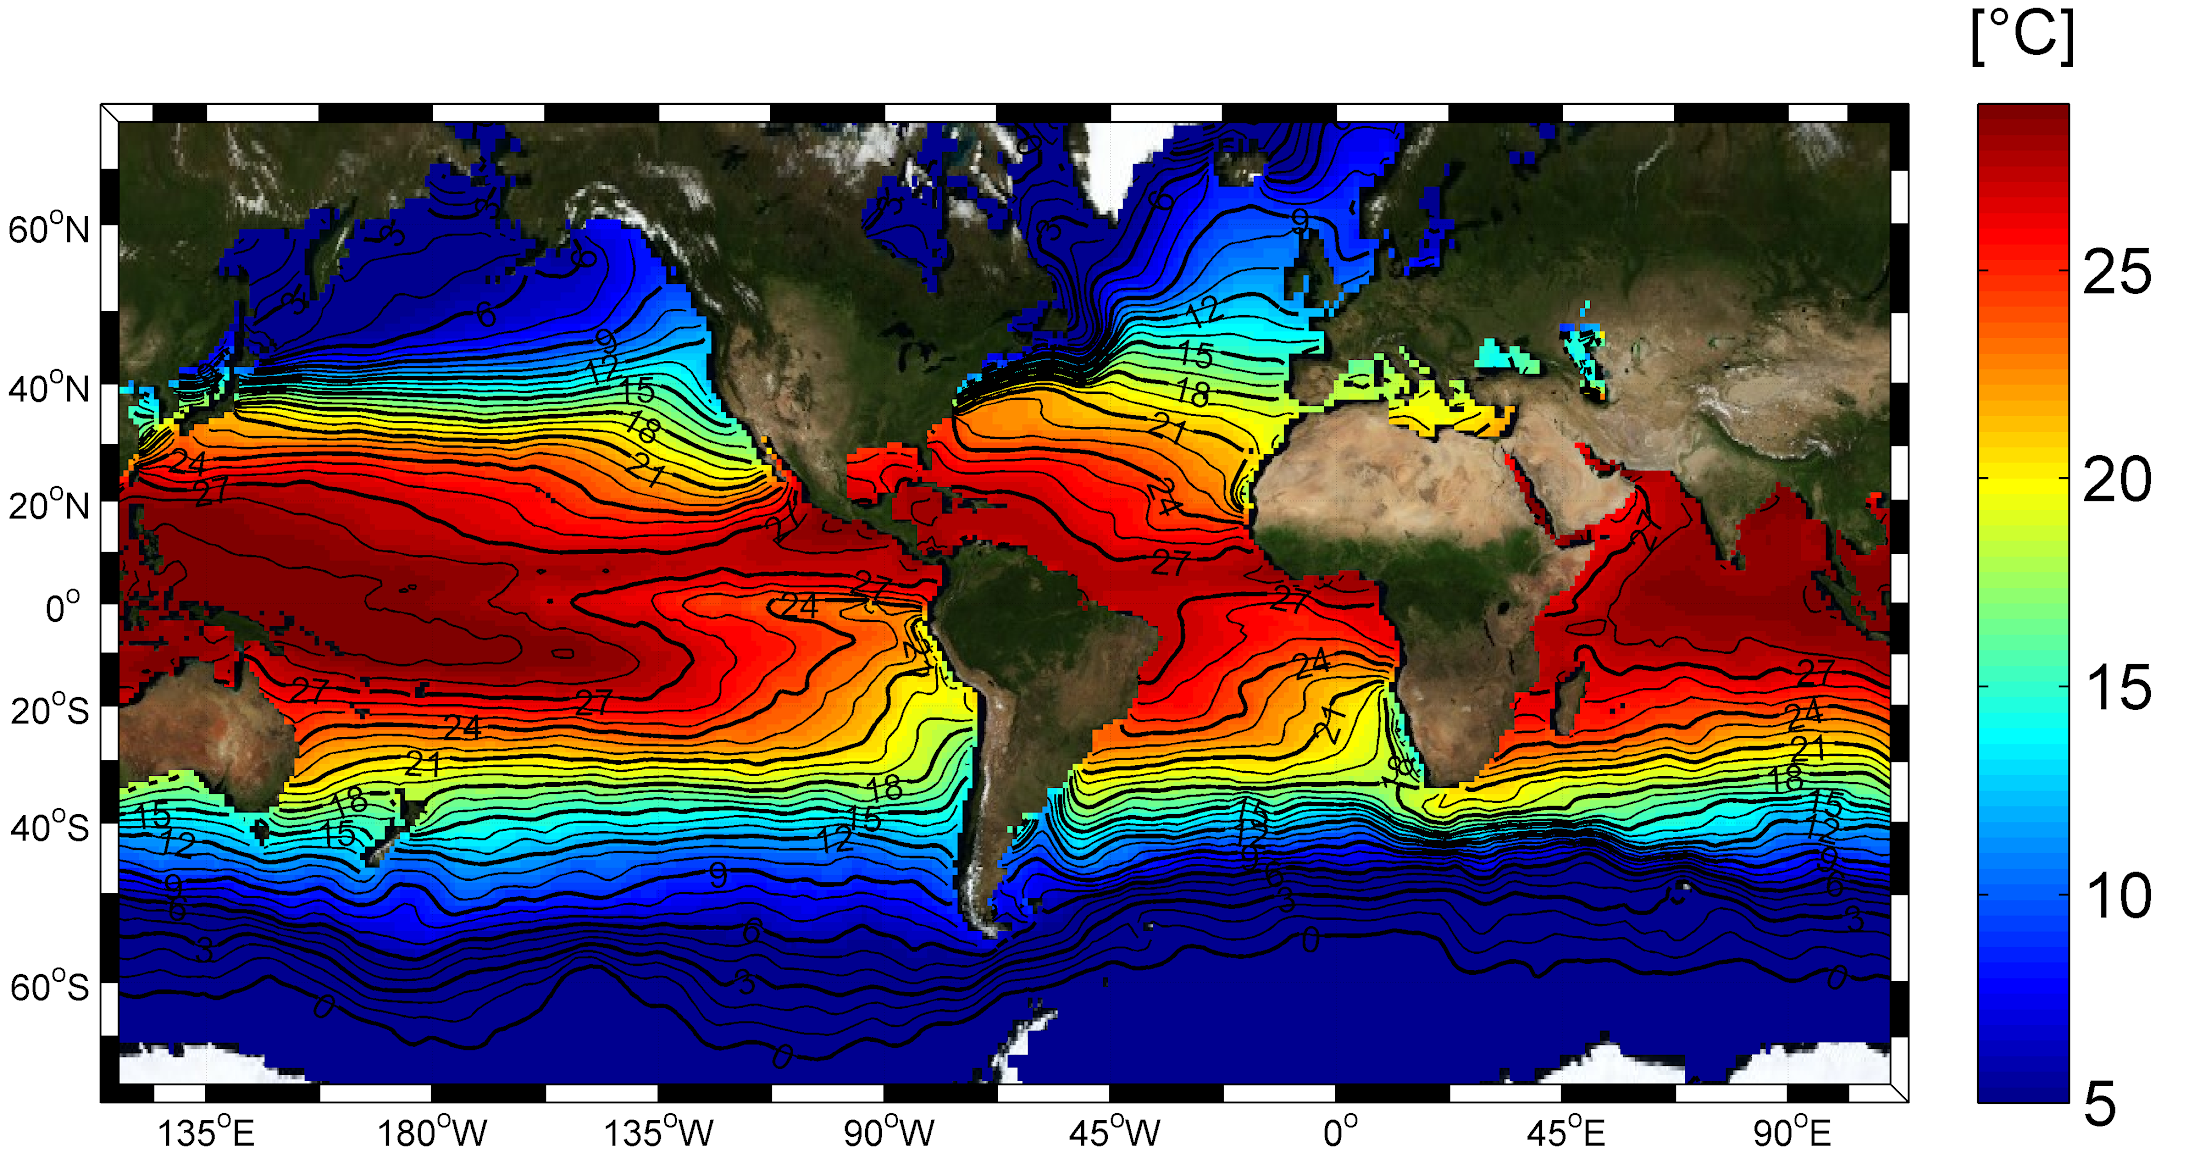
A map showing the changes in water temperature across the Earth.
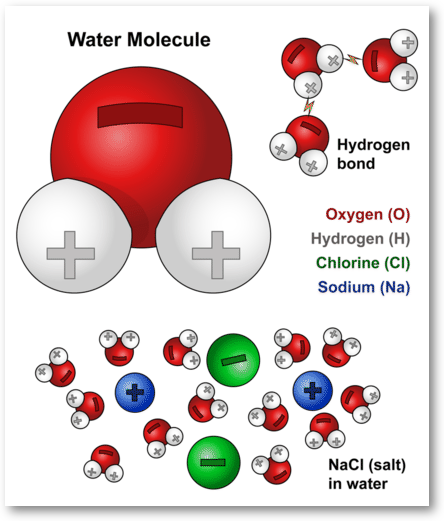
A schematic sketch of the special properties of water, particularly its polar ends, which leads to an attraction between water molecules called "hydrogen bonds"
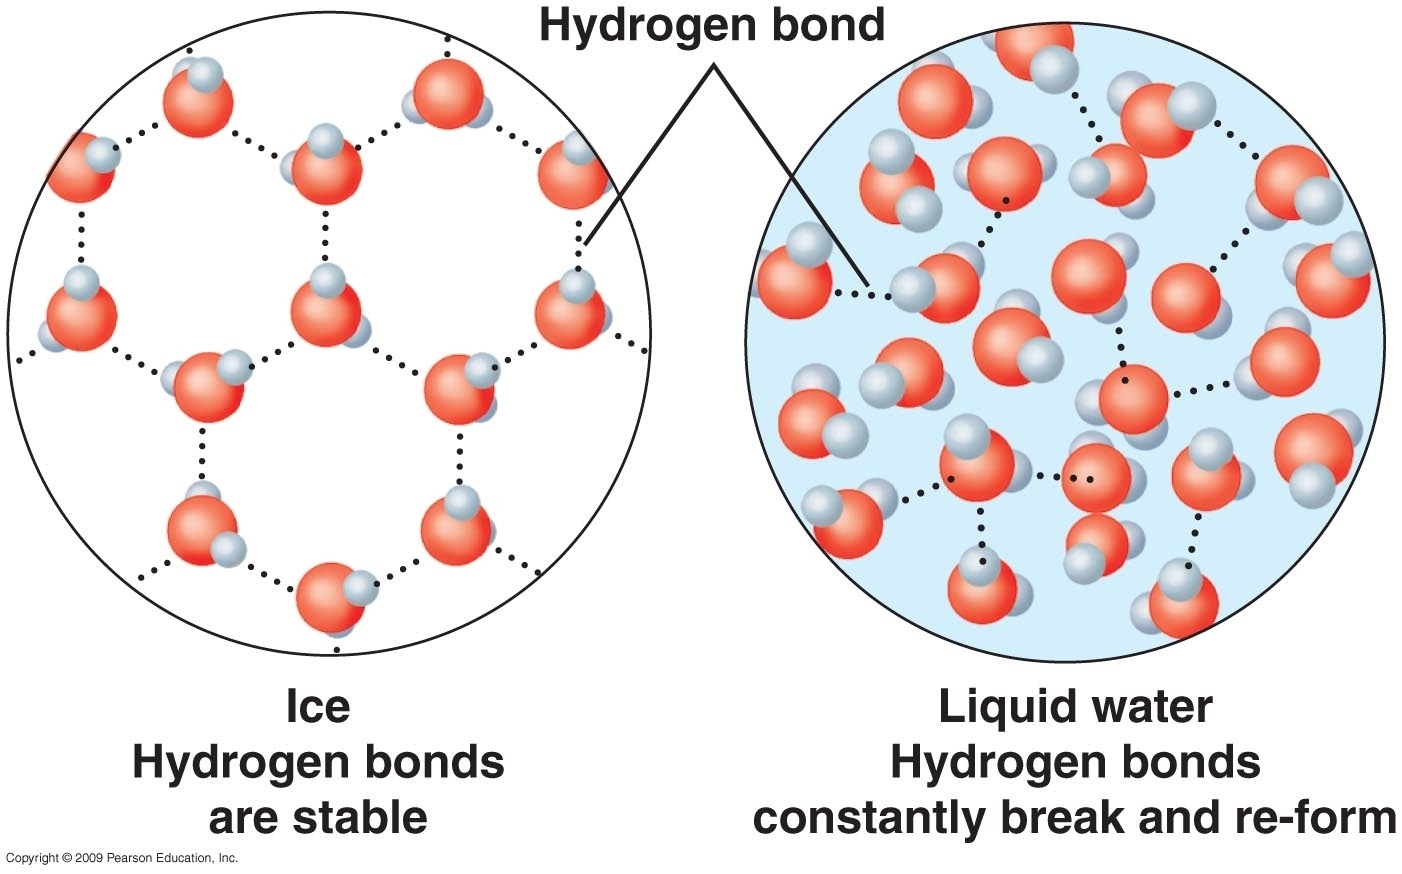
A sketch showing the arrangement of water molecules in ice (left) and in liquid water (right). The lower density of molecules on the left is the reason ice floats.
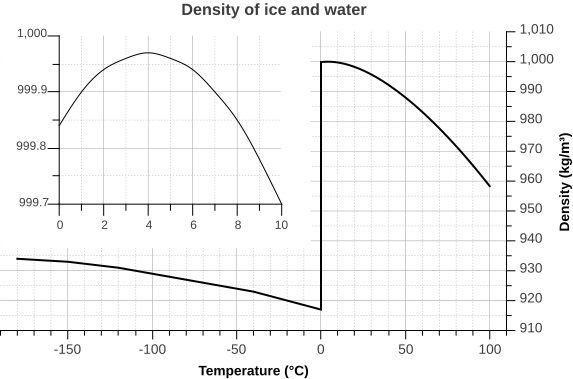
A map showing the changes in water density across different temperatures. Note the sharp drop in density at the transition to ice.
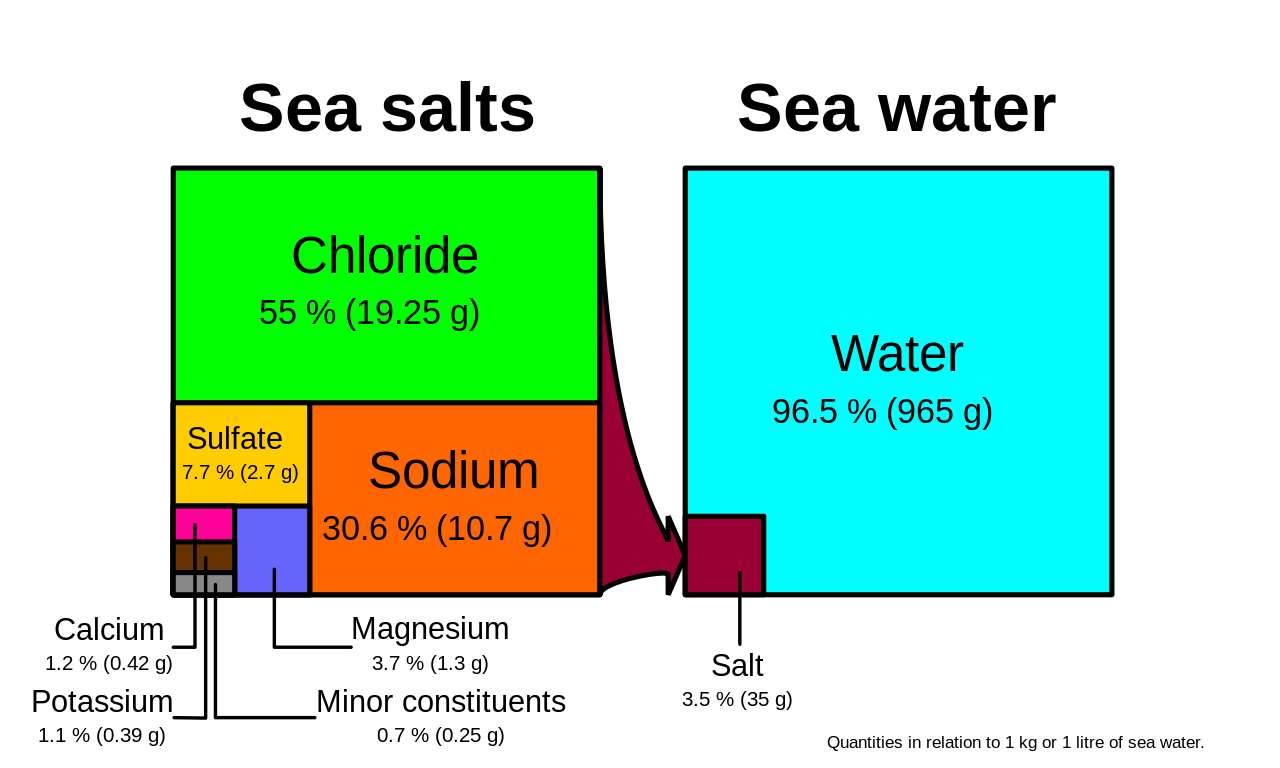
The relative abundance of salts in the ocean. These are all "conservative" ions, whose relative abundance does not change throughout the ocean. So no matter how salty the ocean water is, 55% of that salt is Cl, 30.6% of that salt is Na, etc.
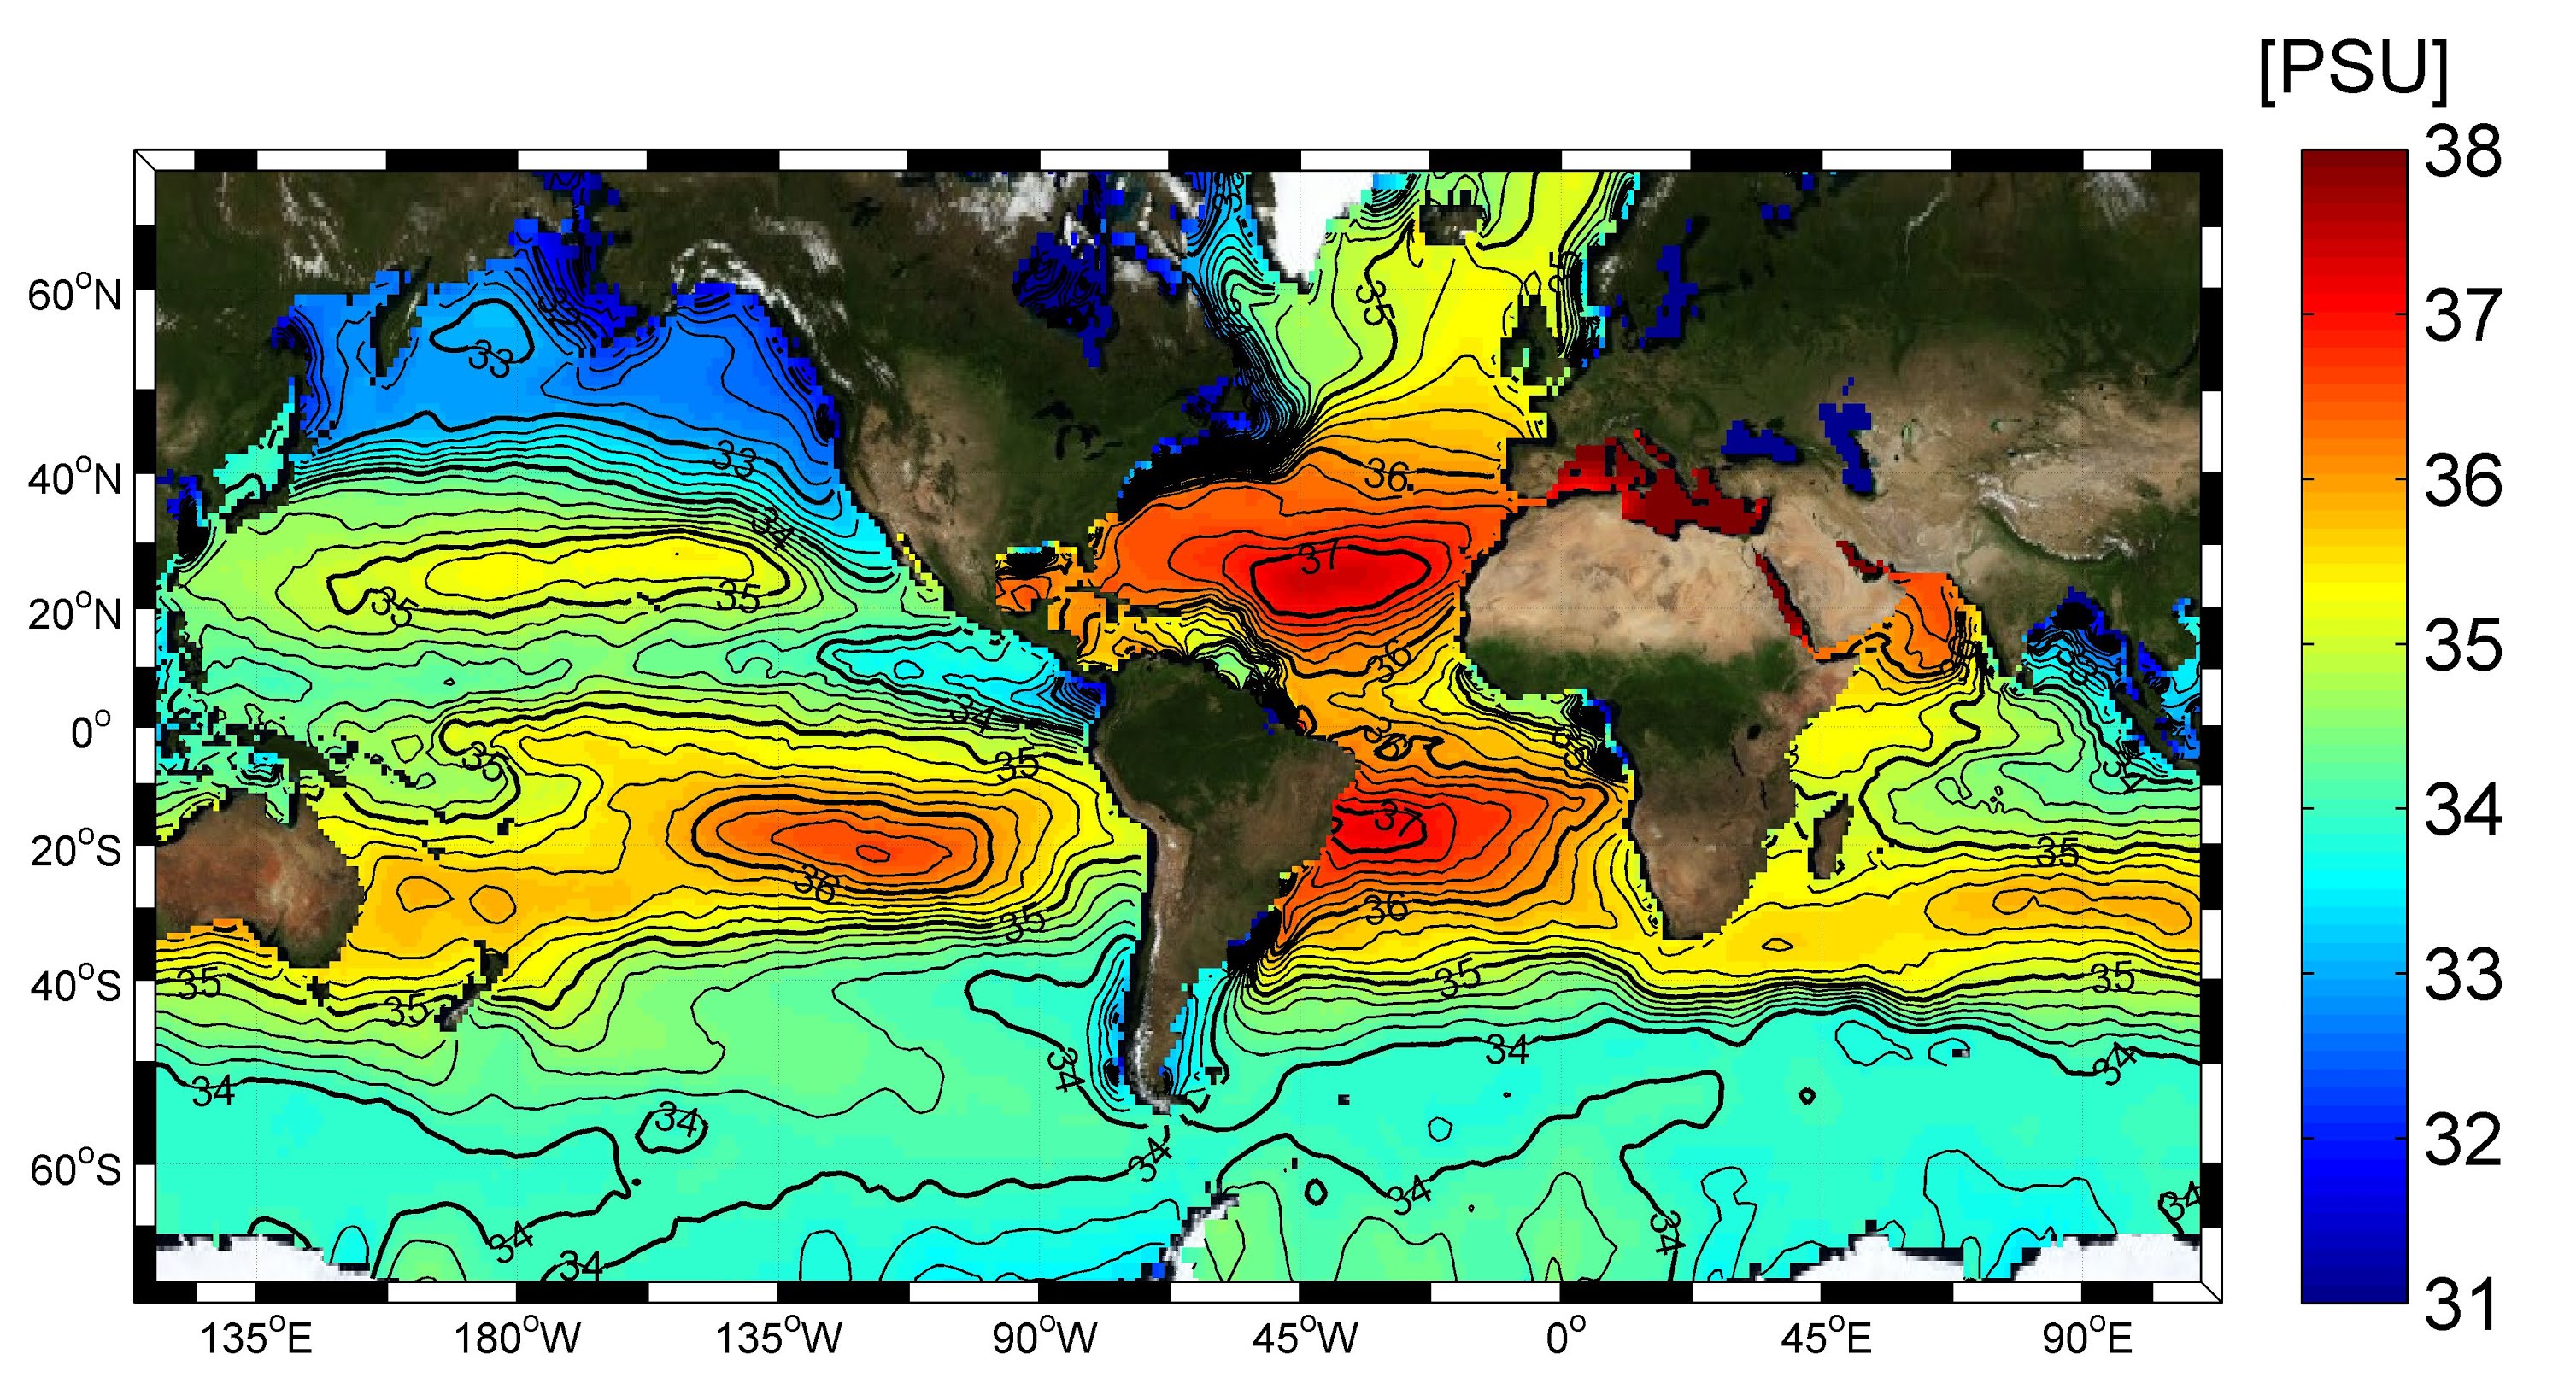
Patterns of salinity through the worlds oceans. Note the elevated salinities in the tropics - 20 to 40 degrees latitude.
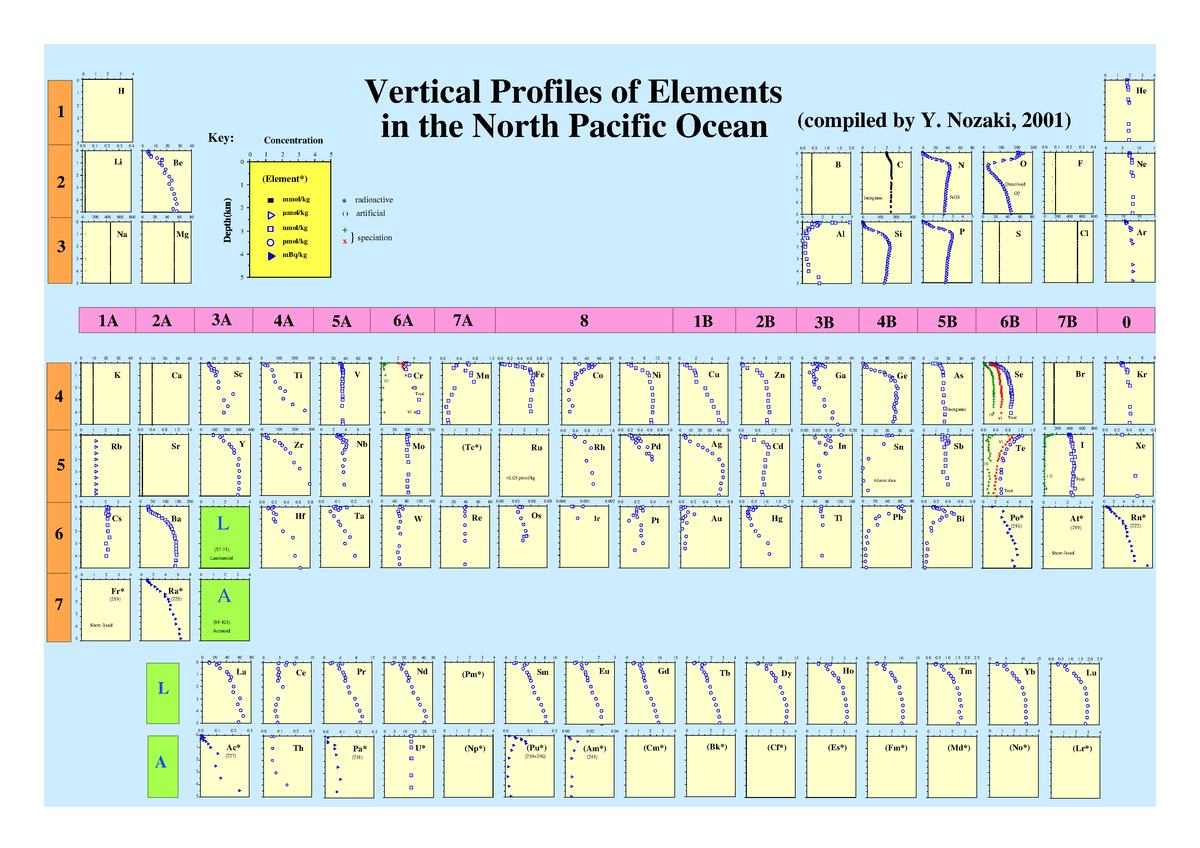
The abundance of different elements at various water depths. Note that conservative ions are mostly straight lines. Nutrients tend to be depleted at the surface and more abundant at medium depths. Observe that the nutrient maximum coincides with a minimum in oxygen.
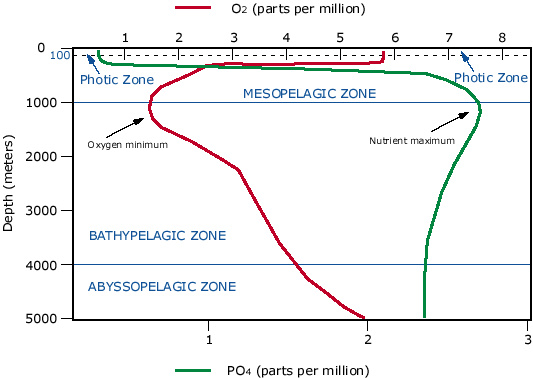
Another plot showing the "oxygen minimum zone", the part of the water column where decomposition of organic matter has resulted in the almost complete consumption of oxygen and a release of nutrients back into the water.
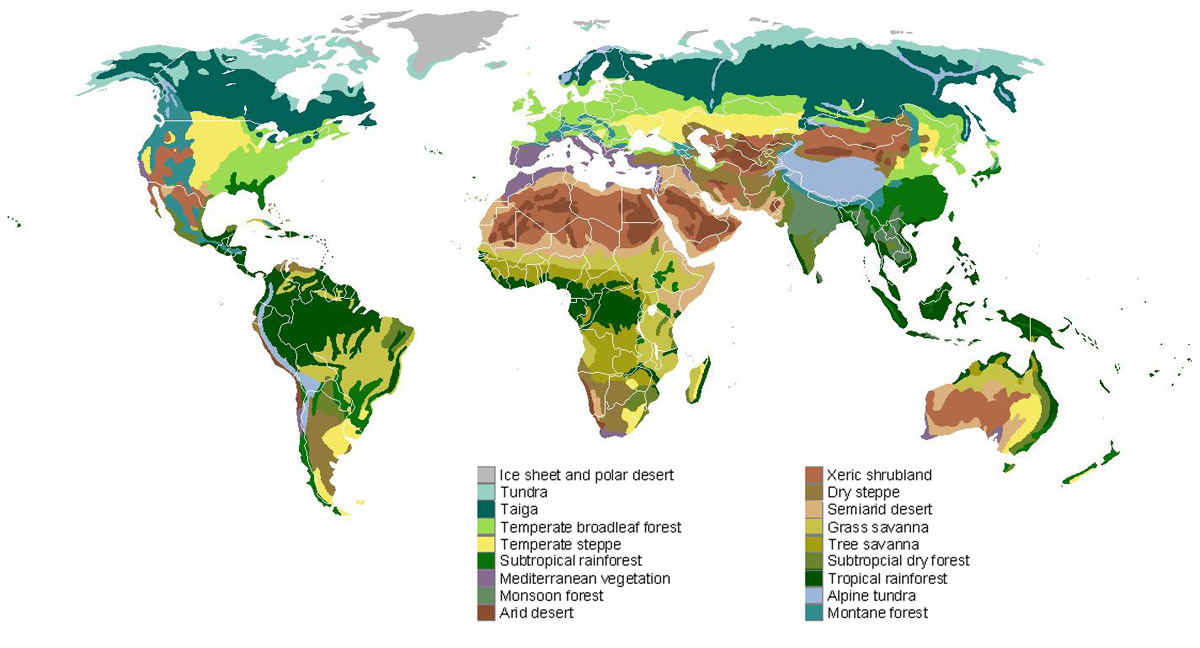
The distribution of climate belts across the Earth's surface. Note the concentration of rainforest around the equator, and deserts in the sub tropics (25 to 35 degrees)
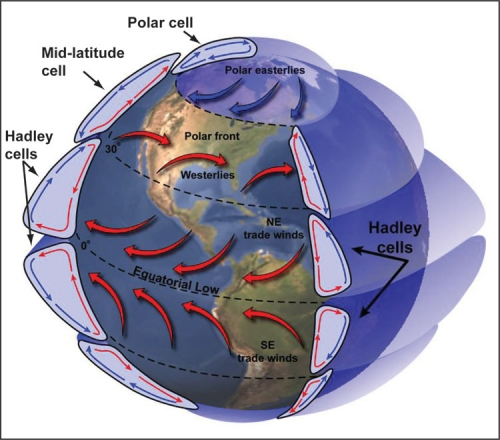
A schematic of the Earth's atmospheric cells. Note that the "Mid-latitude cell" is often referred to as the "Ferrell Cell".
An illustration of the coriolis effect.
An illustration of the coriolis effect in the northern hemisphere, where the paths of objects is deflected to the right. In the southern hemisphere the path of an object is deflected to the left.
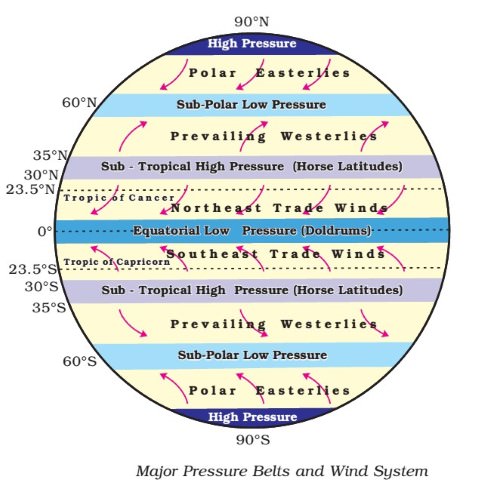
The names of the principal winds and latitude belts.
An illustration of the relation between wind and water currents. Owing to coriolis effect, wind blowing over water results in a deflection of sea currents.
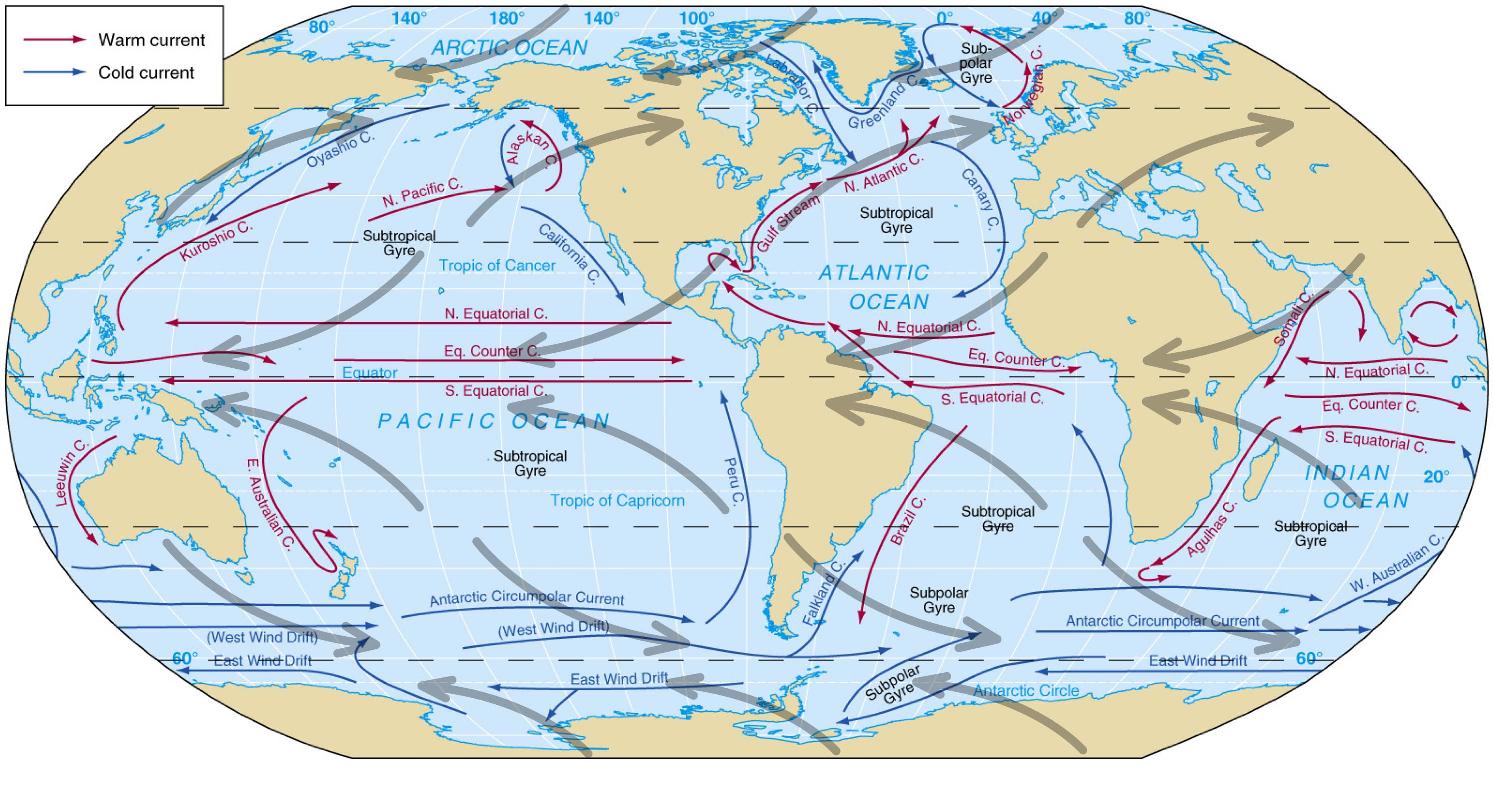
The names and paths of the major sea currents. Note the flow of cold currents up the east side of continents, and warm currents up the west side of continents.
The Wilson cycle, the evolution of a tectonic margin from initial rifting to final uplift.
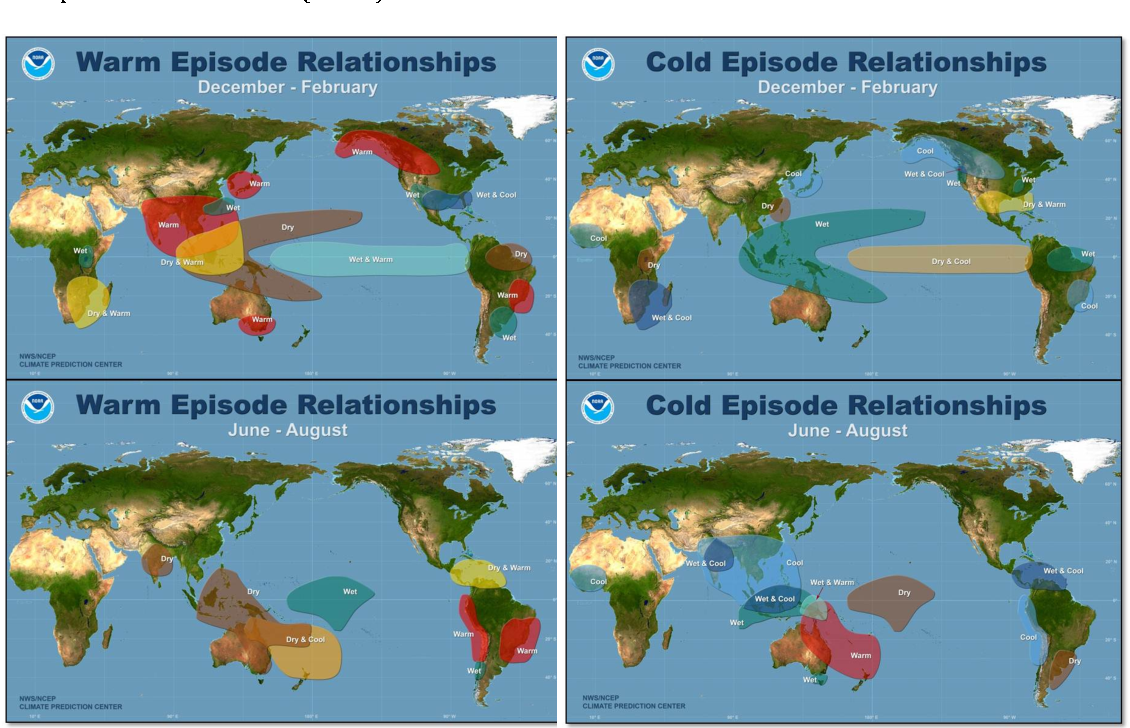
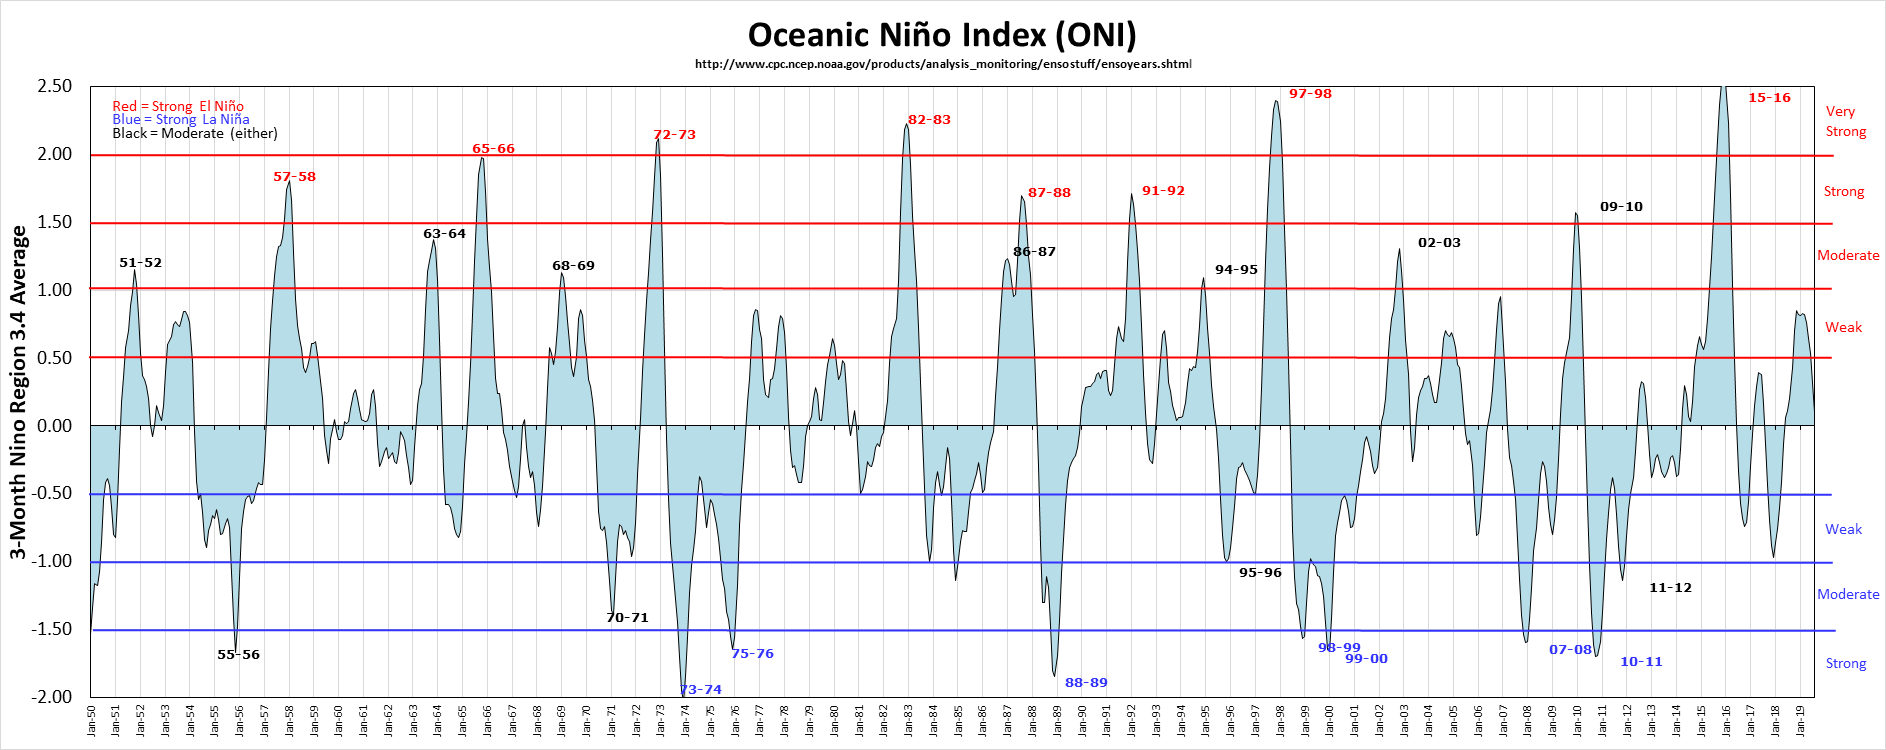
Map showing the effects of El Nino (left) and La Nina (right) on regional climate patterns
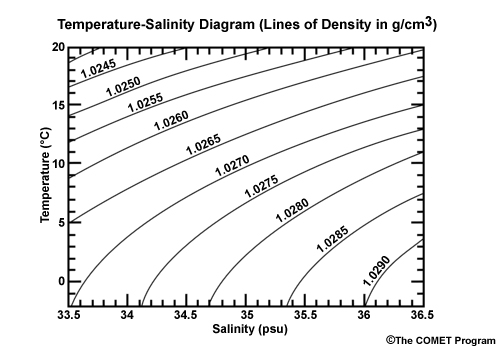
A plot showing the relationship between water temperature, salinity, and water density.
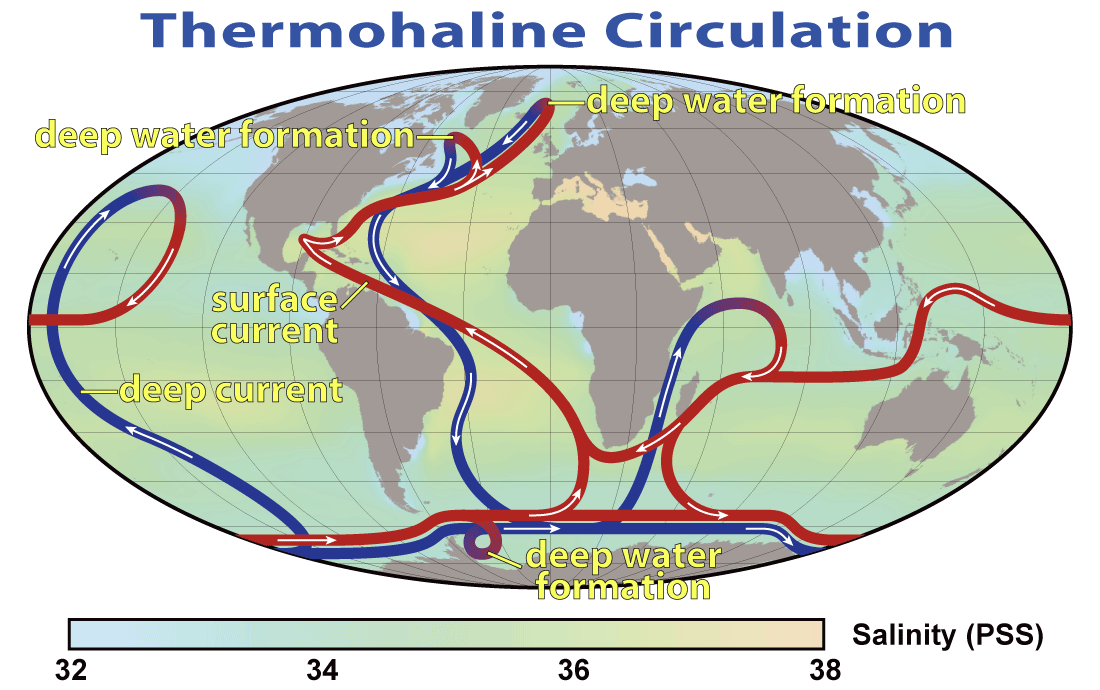
A schematic map showing the path of thermohaline circulation through the world's oceans and the sites of deep water formation.
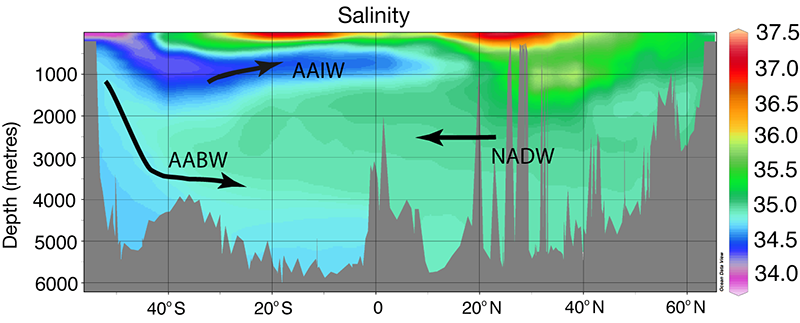
A cross section of the different water masses in the Atlantic Ocean. This is essentially a side view of the Atlantic ocean, with the south pole on the left side and the north pole at the right. AABW: Antarctic Bottom Water. AAIW: Antarctic Intermediate Water. NADW: North Atlantic Deep Water
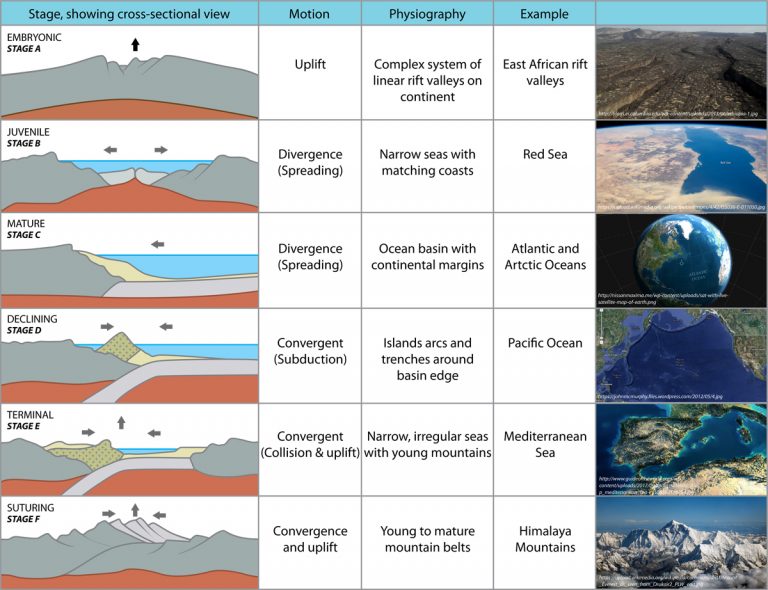
The Wilson cycle, the evolution of a tectonic margin from initial rifting to final uplift.
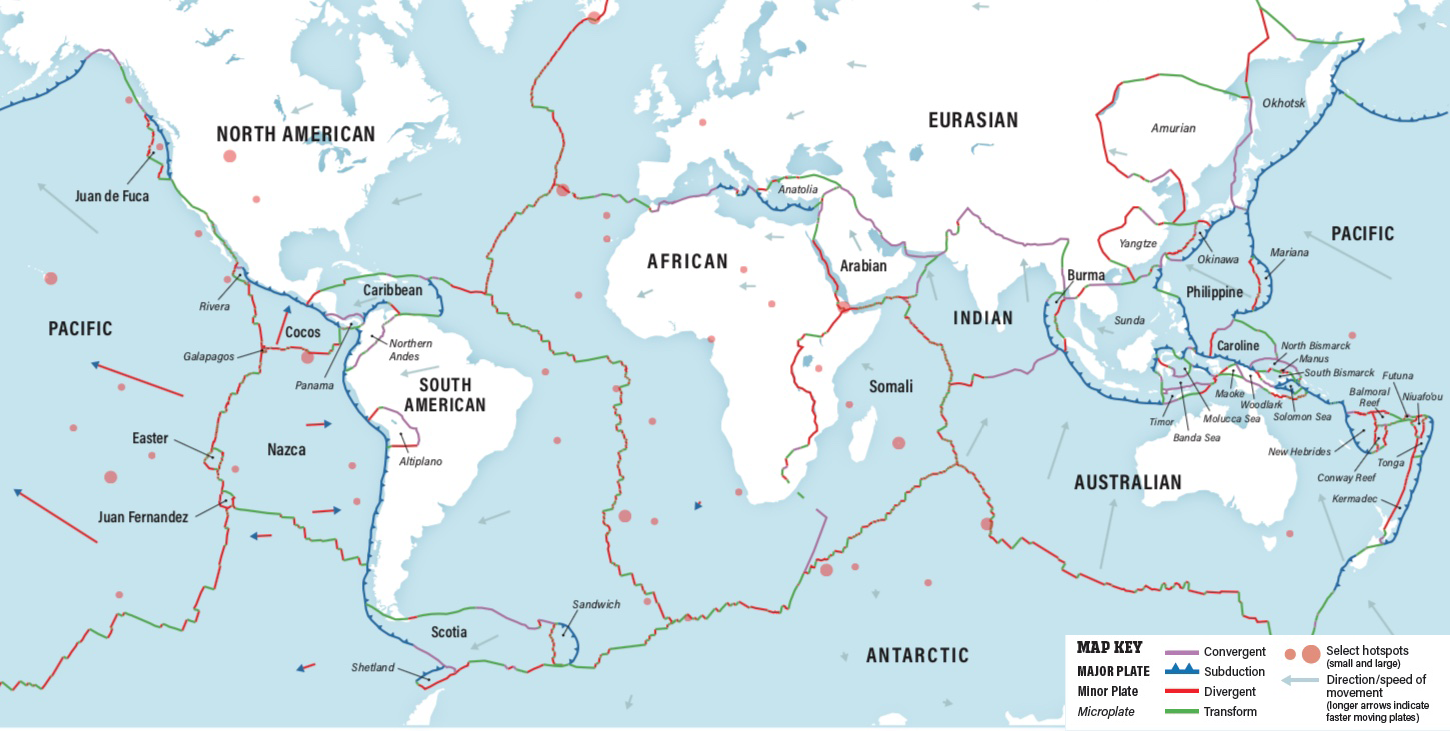
A comprehensive map of the different tectonic plates.
A summary of the tidal forces acting on the Earth.
A video illustrating how the differential forces of the Moon's gravity causes tides..
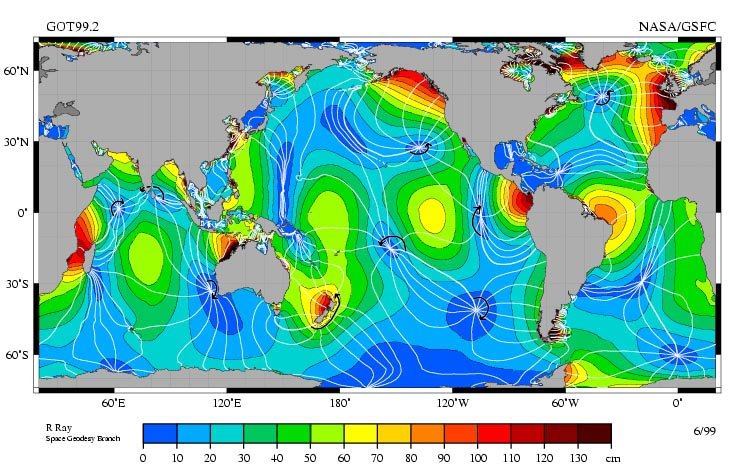
A map showing the magnitude of tides across the Earth
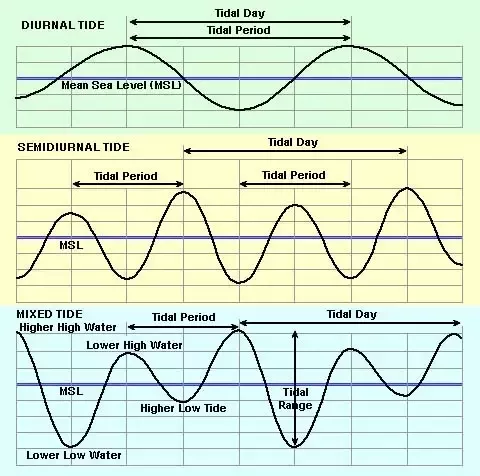
A schematic chart showing the various types of tides.
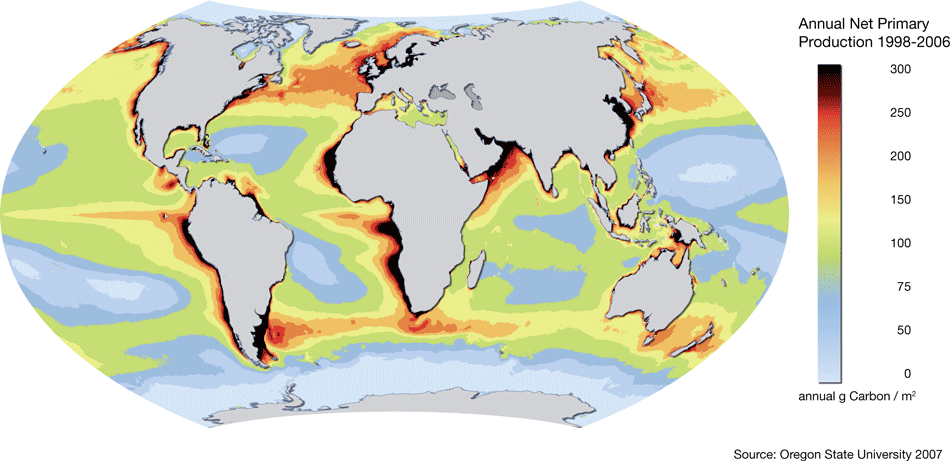
A map showing the intensity of primary productivity (photosynthesis) in the surface oceans.
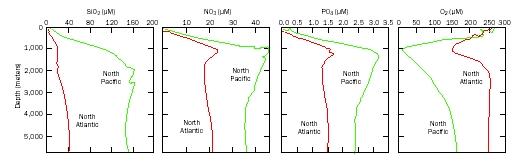
Vertical profiles of the worlds oceans showing the concentrations of critical elements.
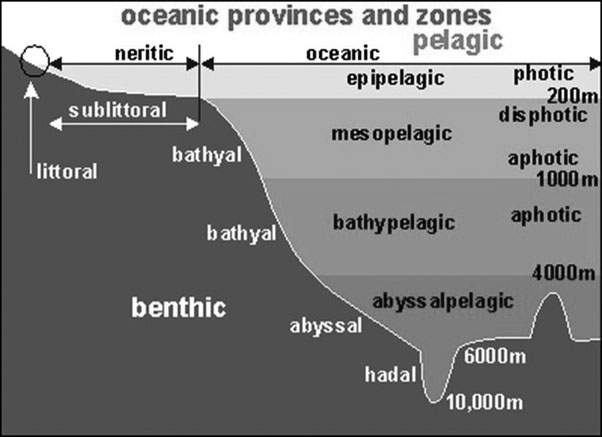
A summary of the ocean's different regions.
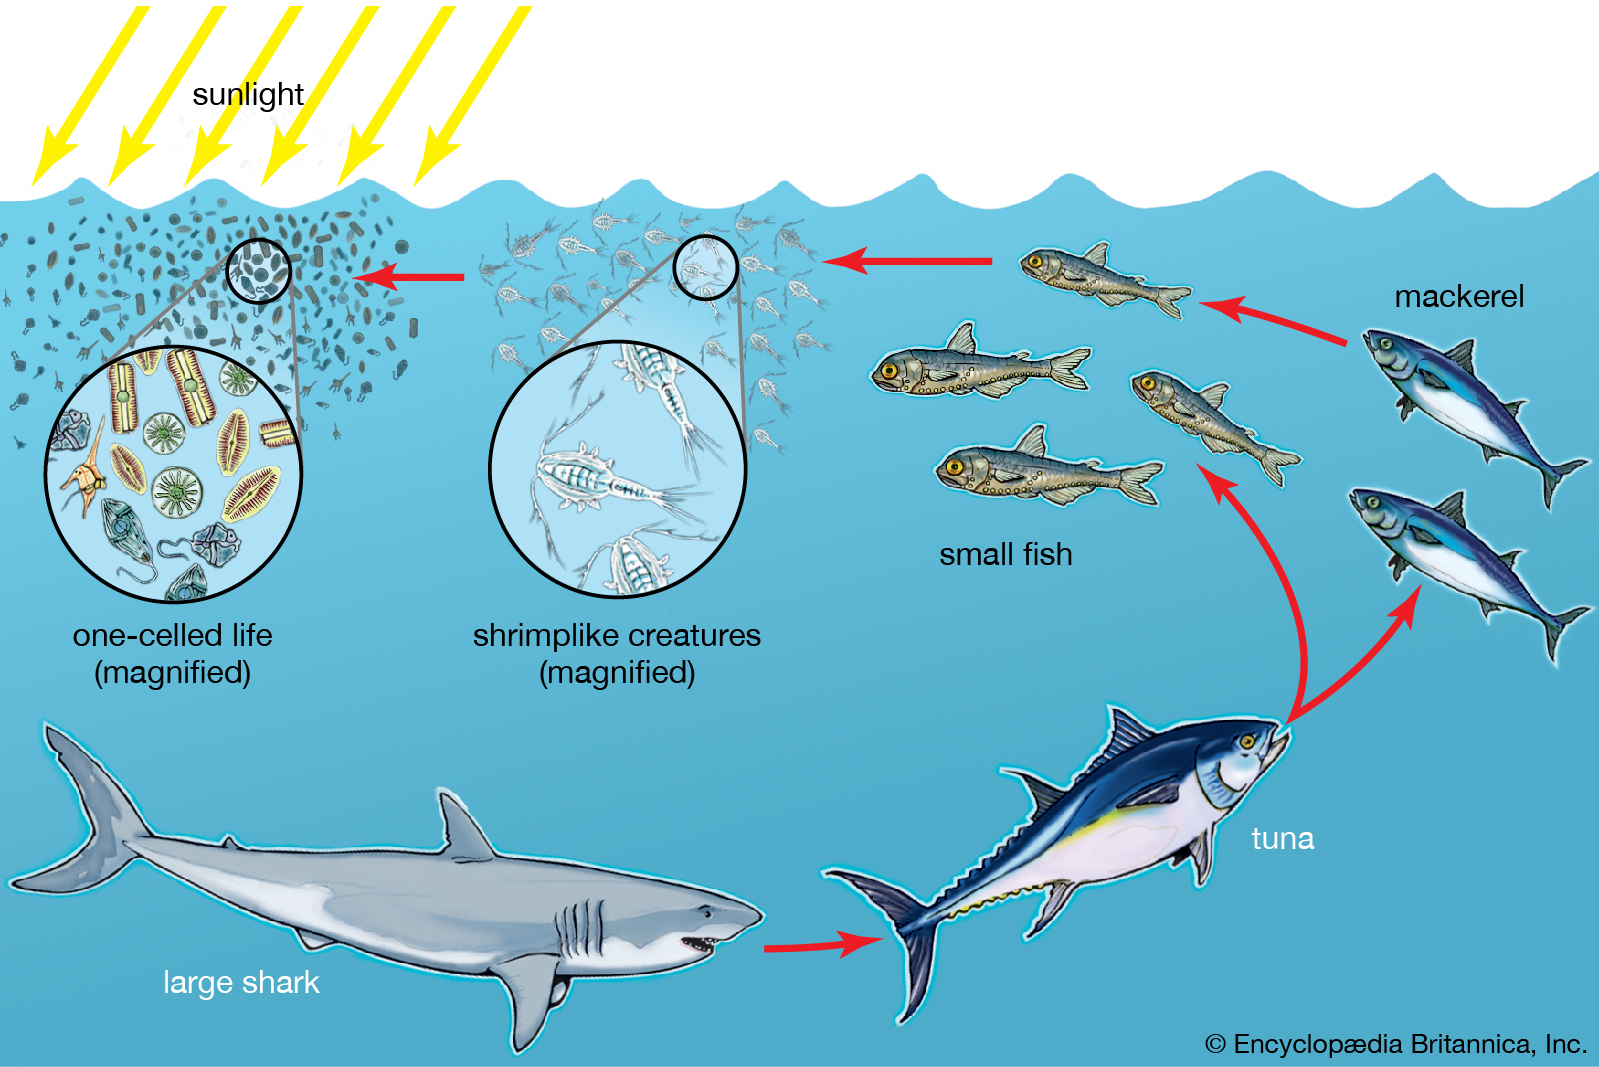
A schematic marine food chain.
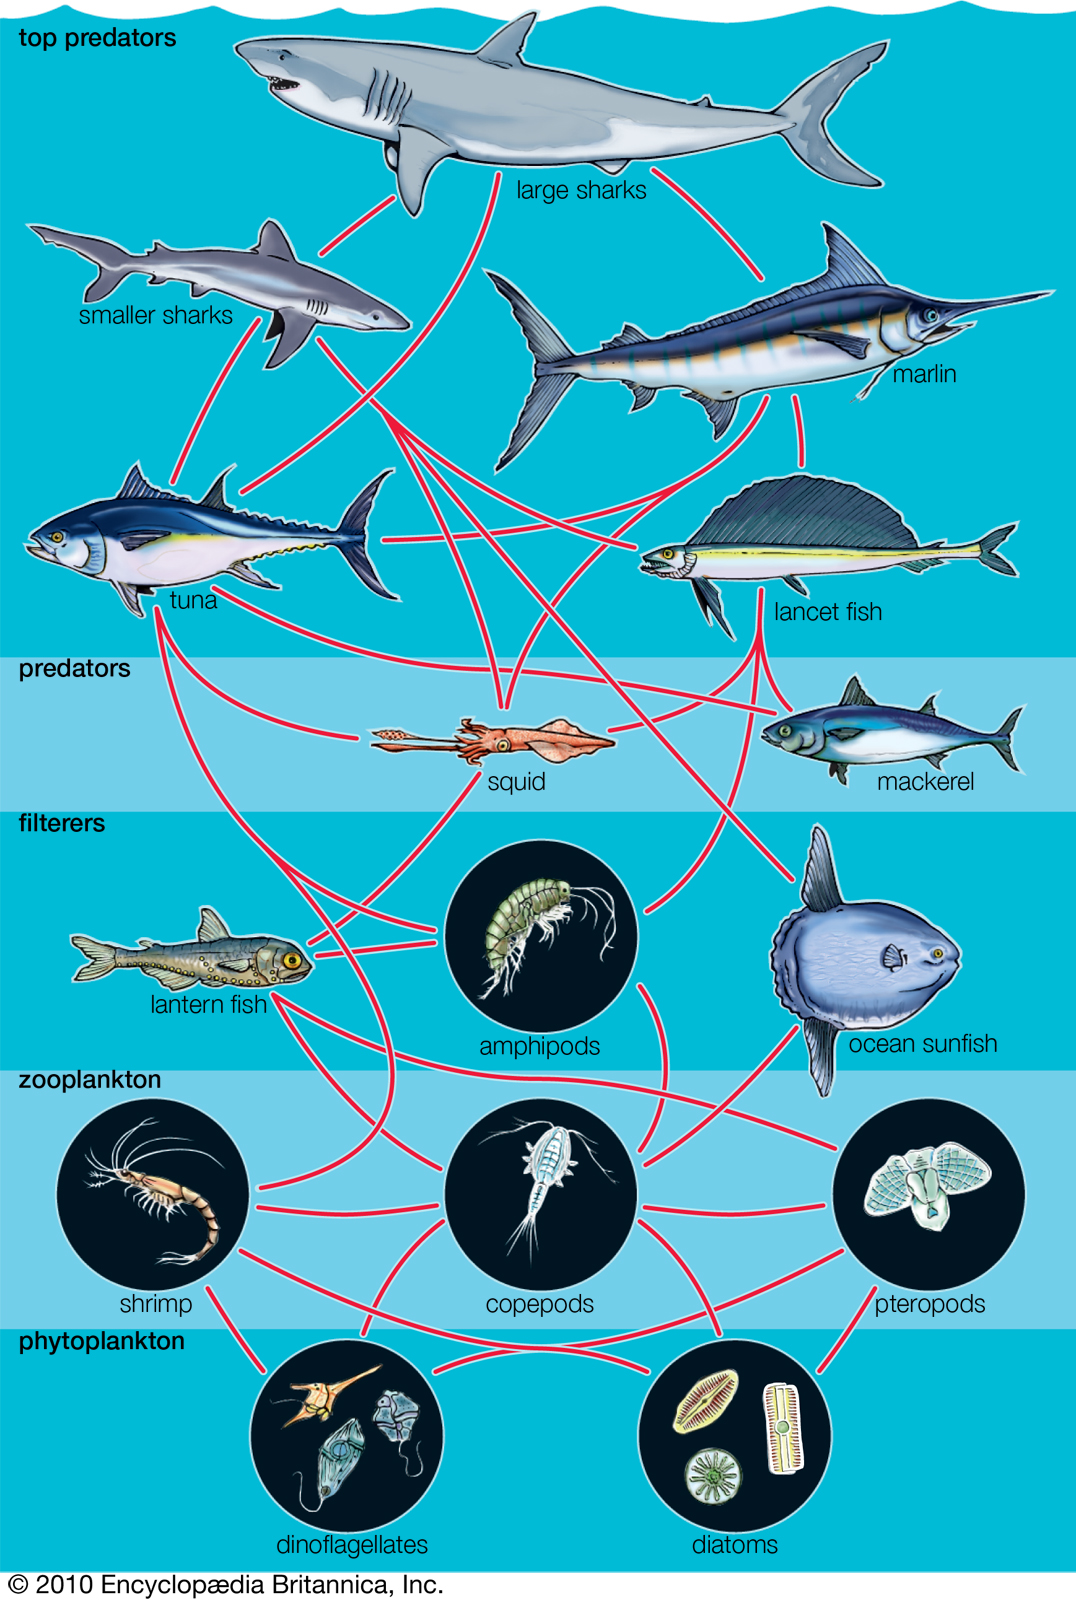
A more realistically complex food web, showing the relationships between different organisms.
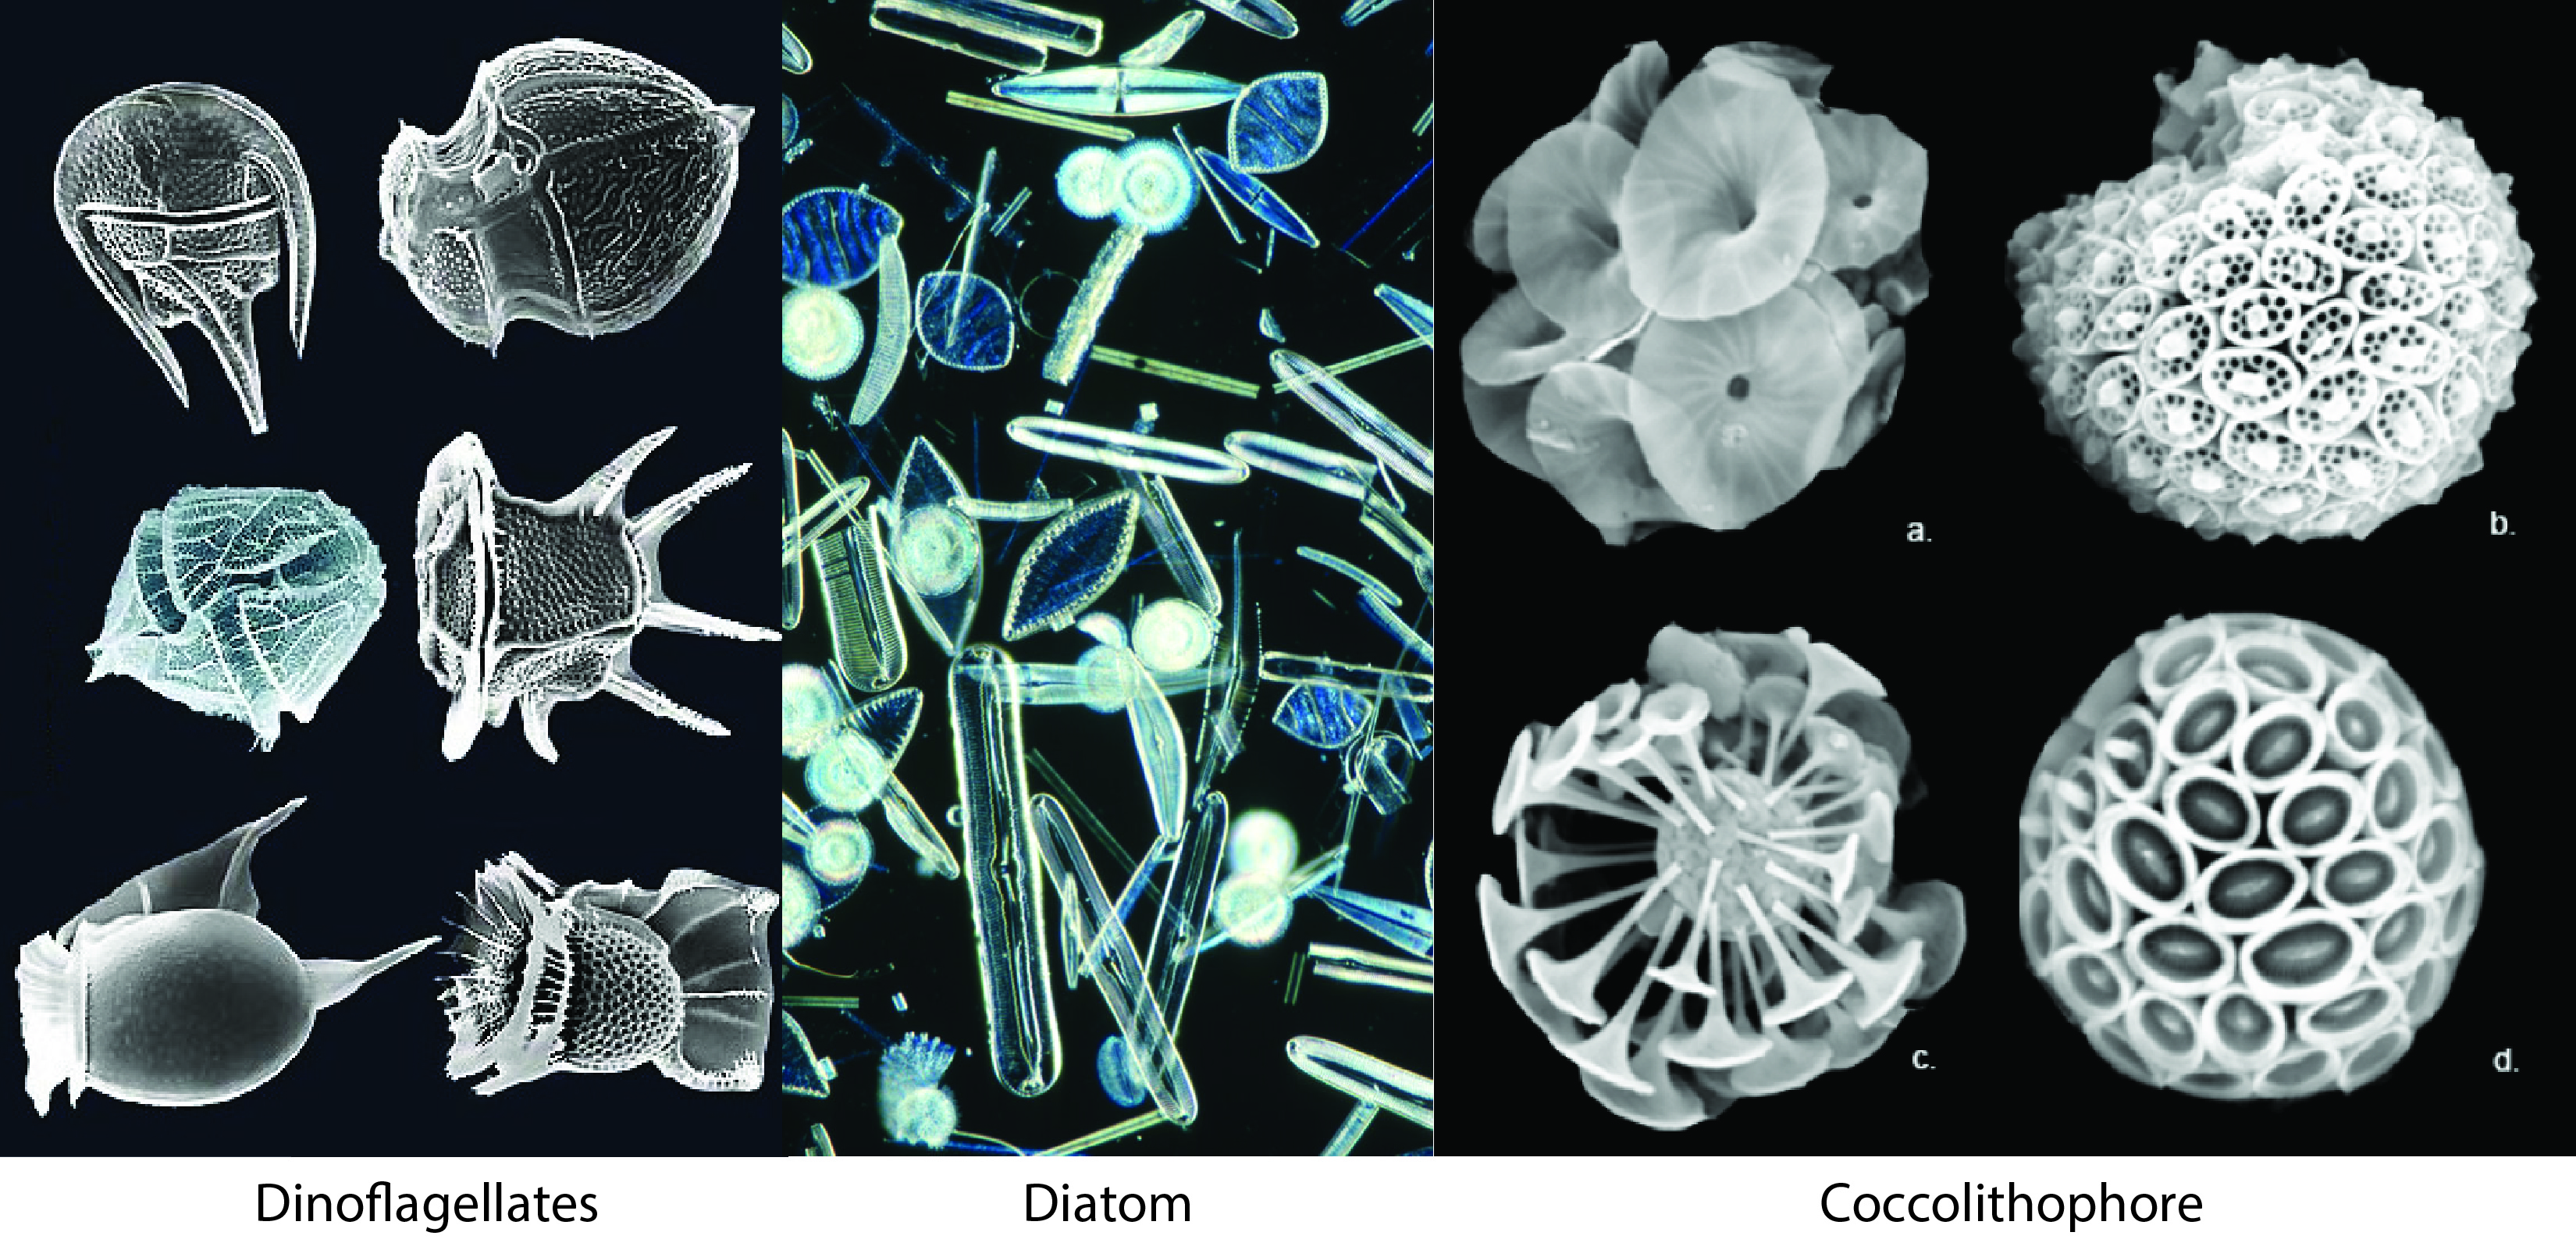
Common phytoplankton in the Earth's oceans. These are photosynthesizers.
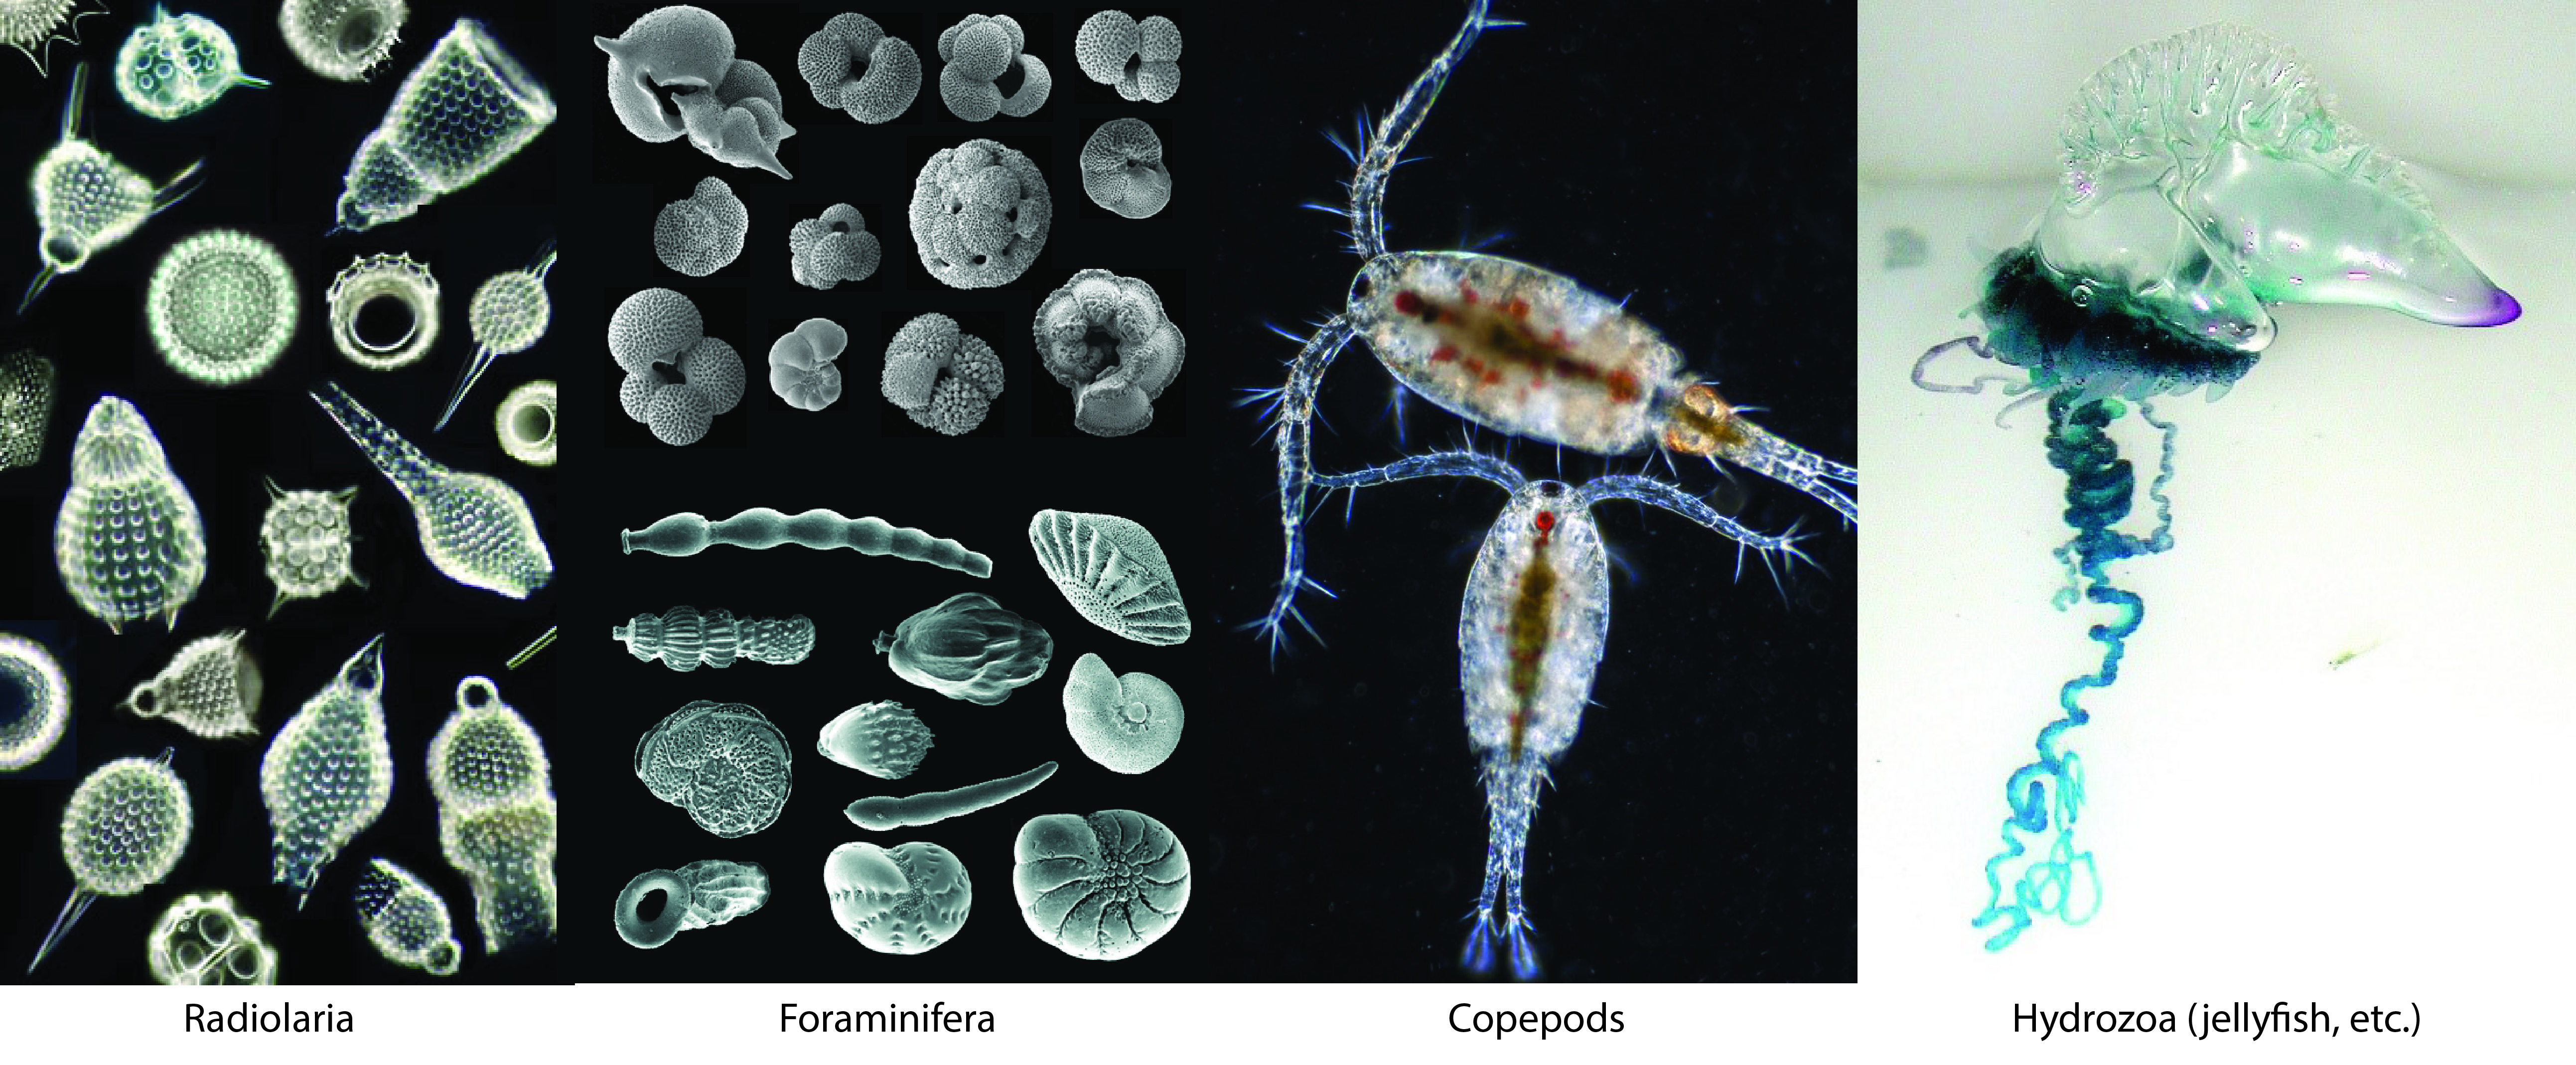
Common zooplankton in the Earth's oceans. Generally, these tend to be primary consumers.
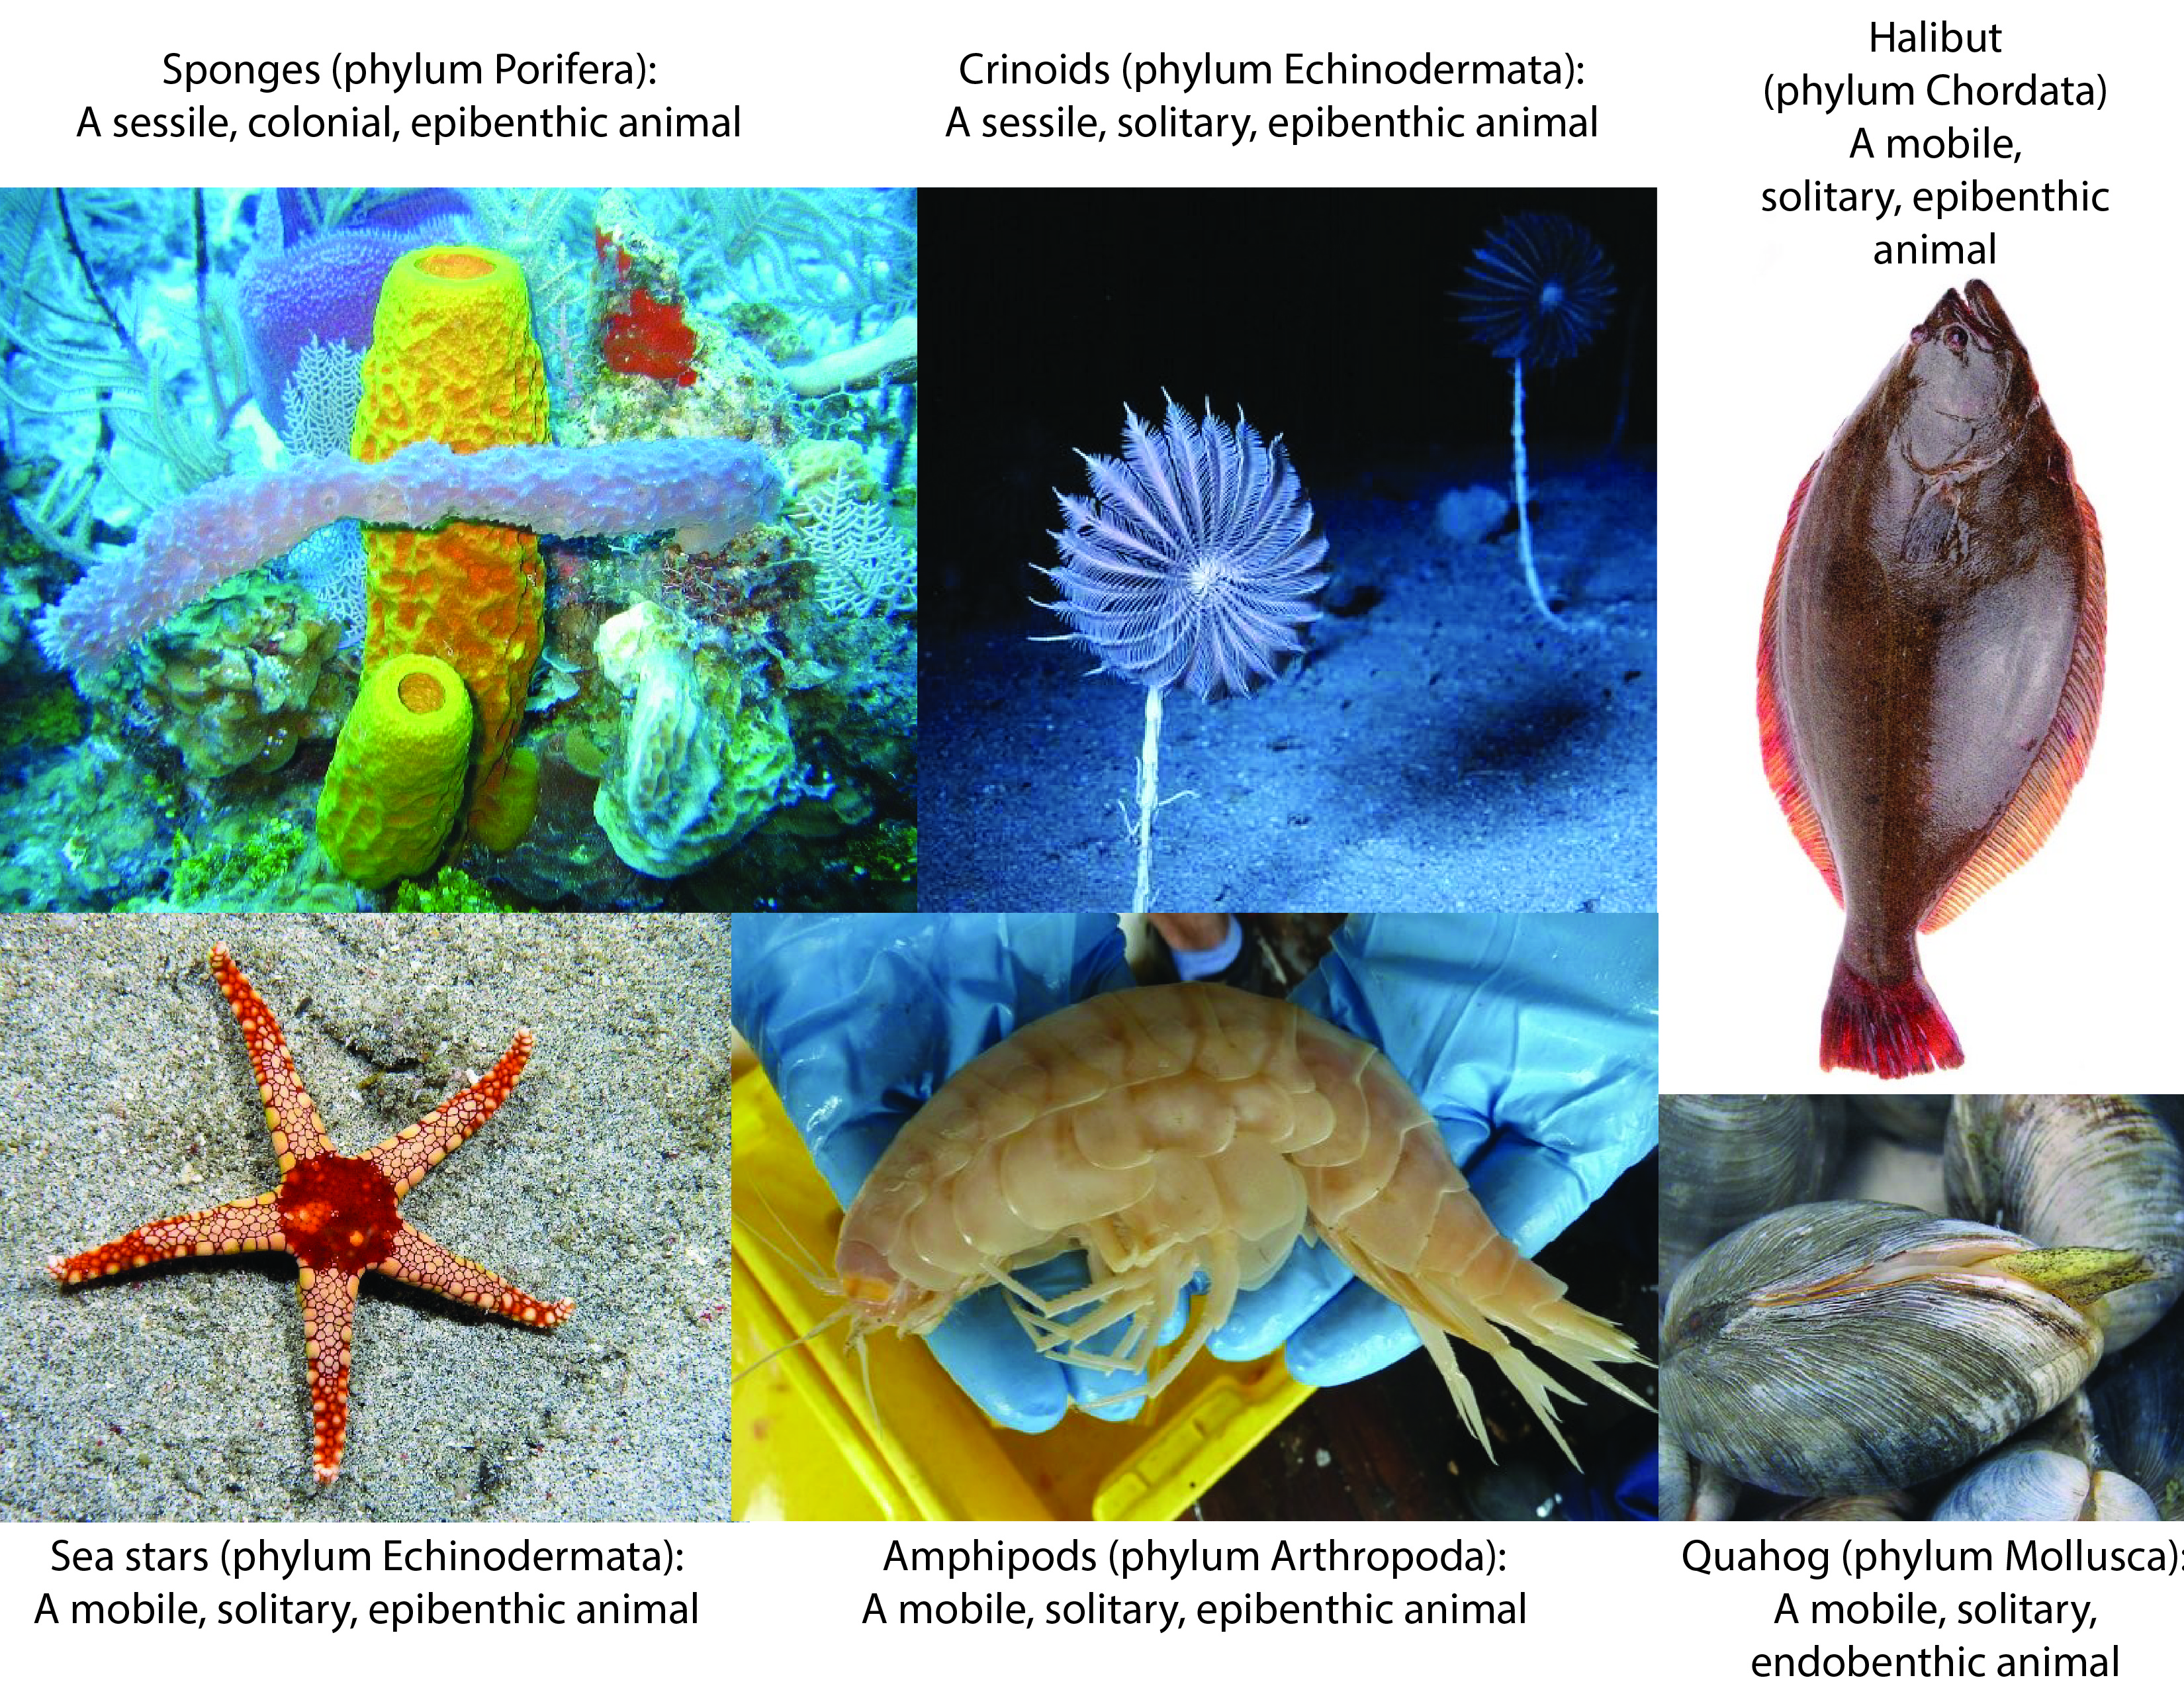
Some common benthic organisms, meaning they live on the seafloor.
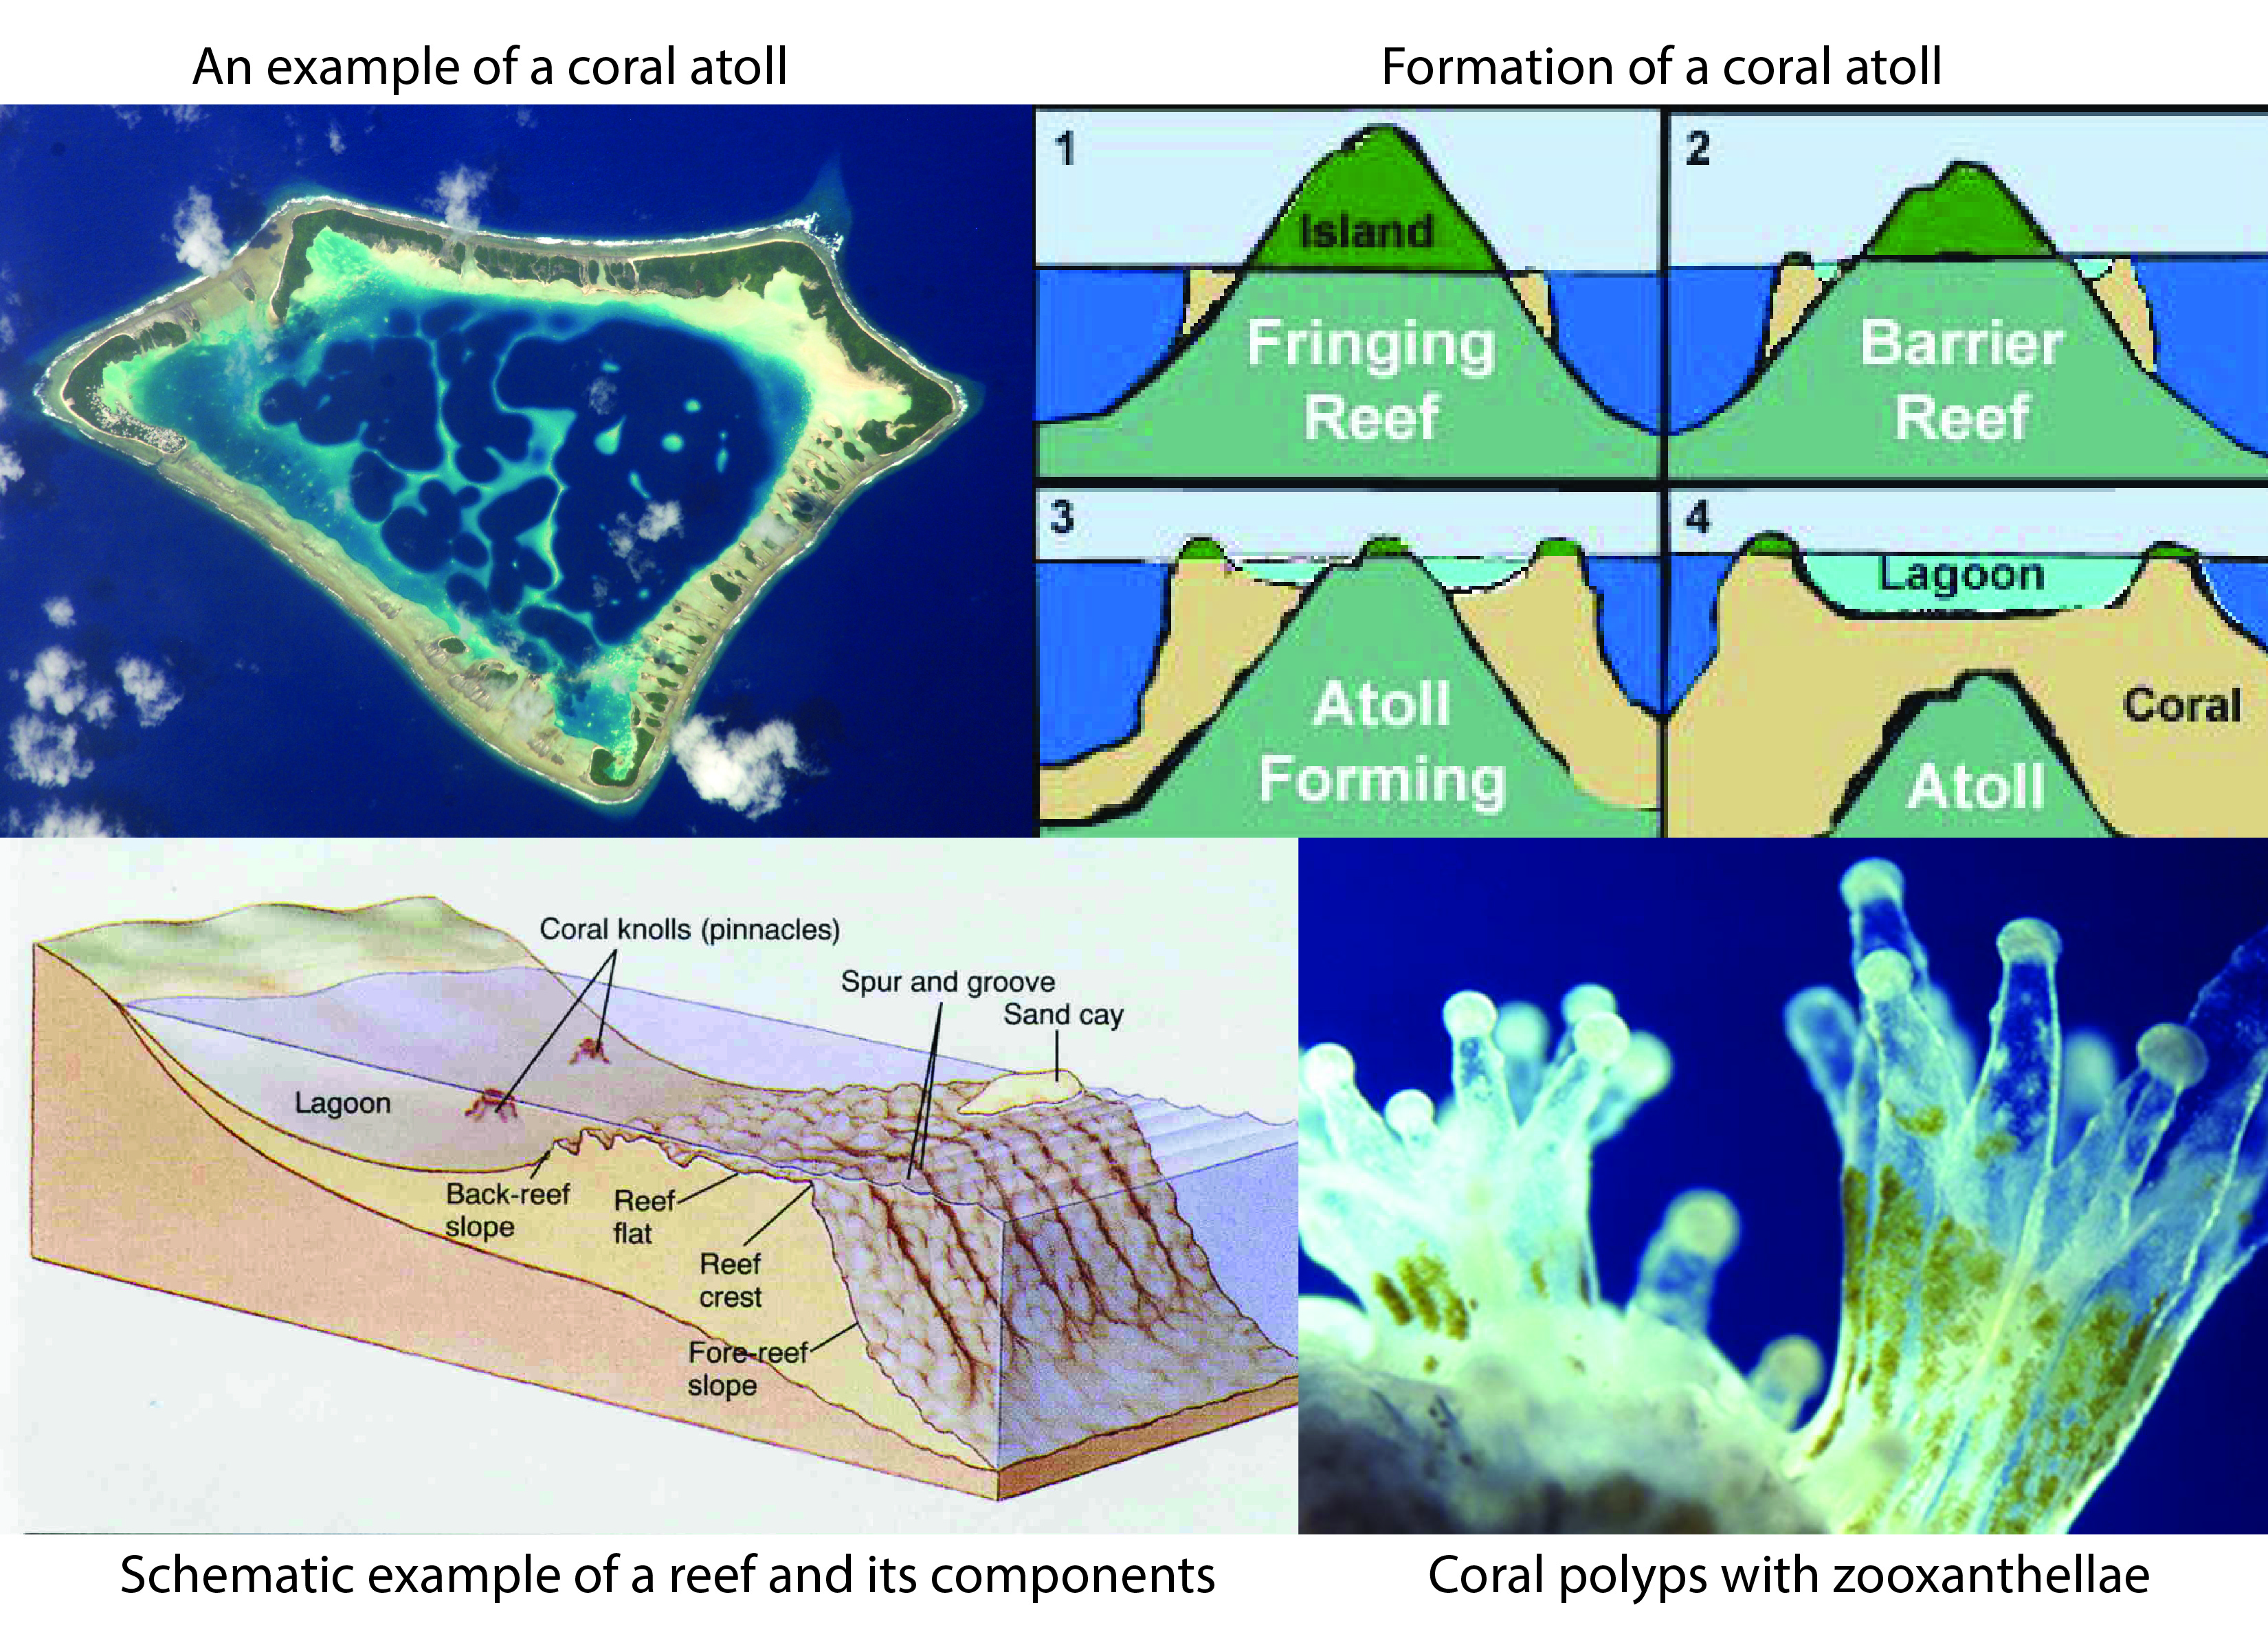
Corals are a common epibenthic, colonial organism. In large groups they can form huge piles of material.
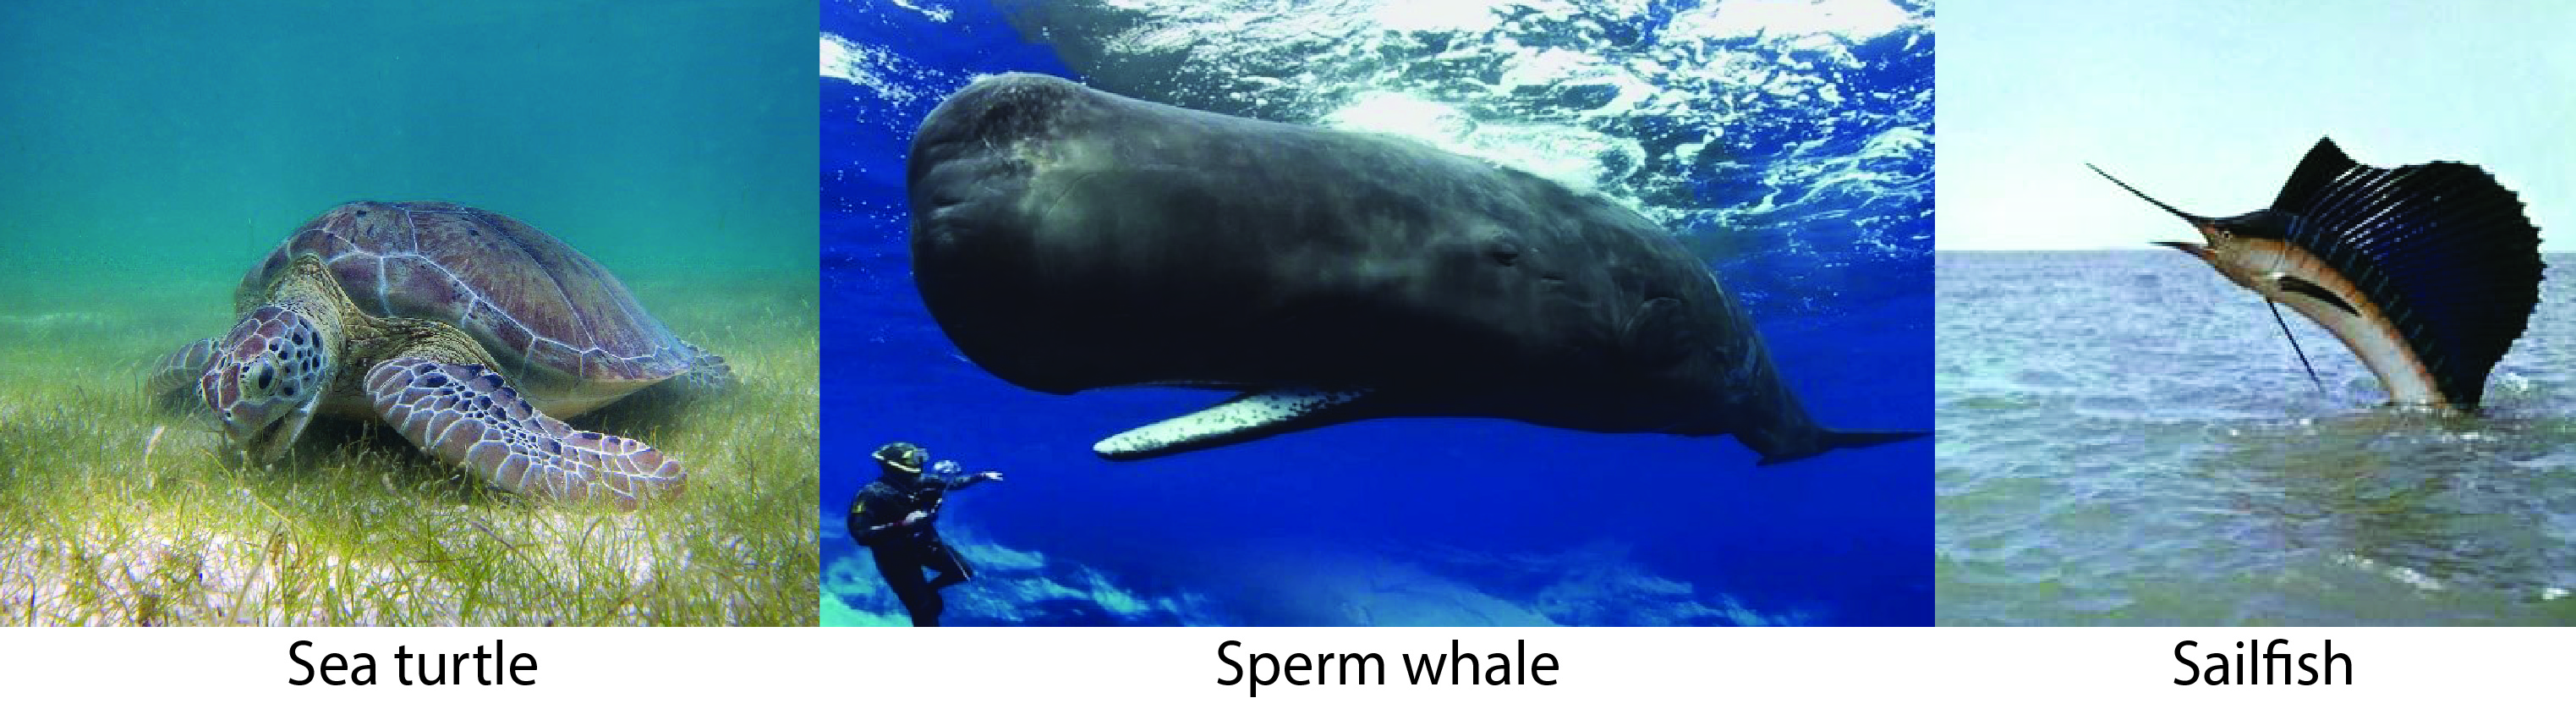
Some well known nektic (free swimming) organisms.
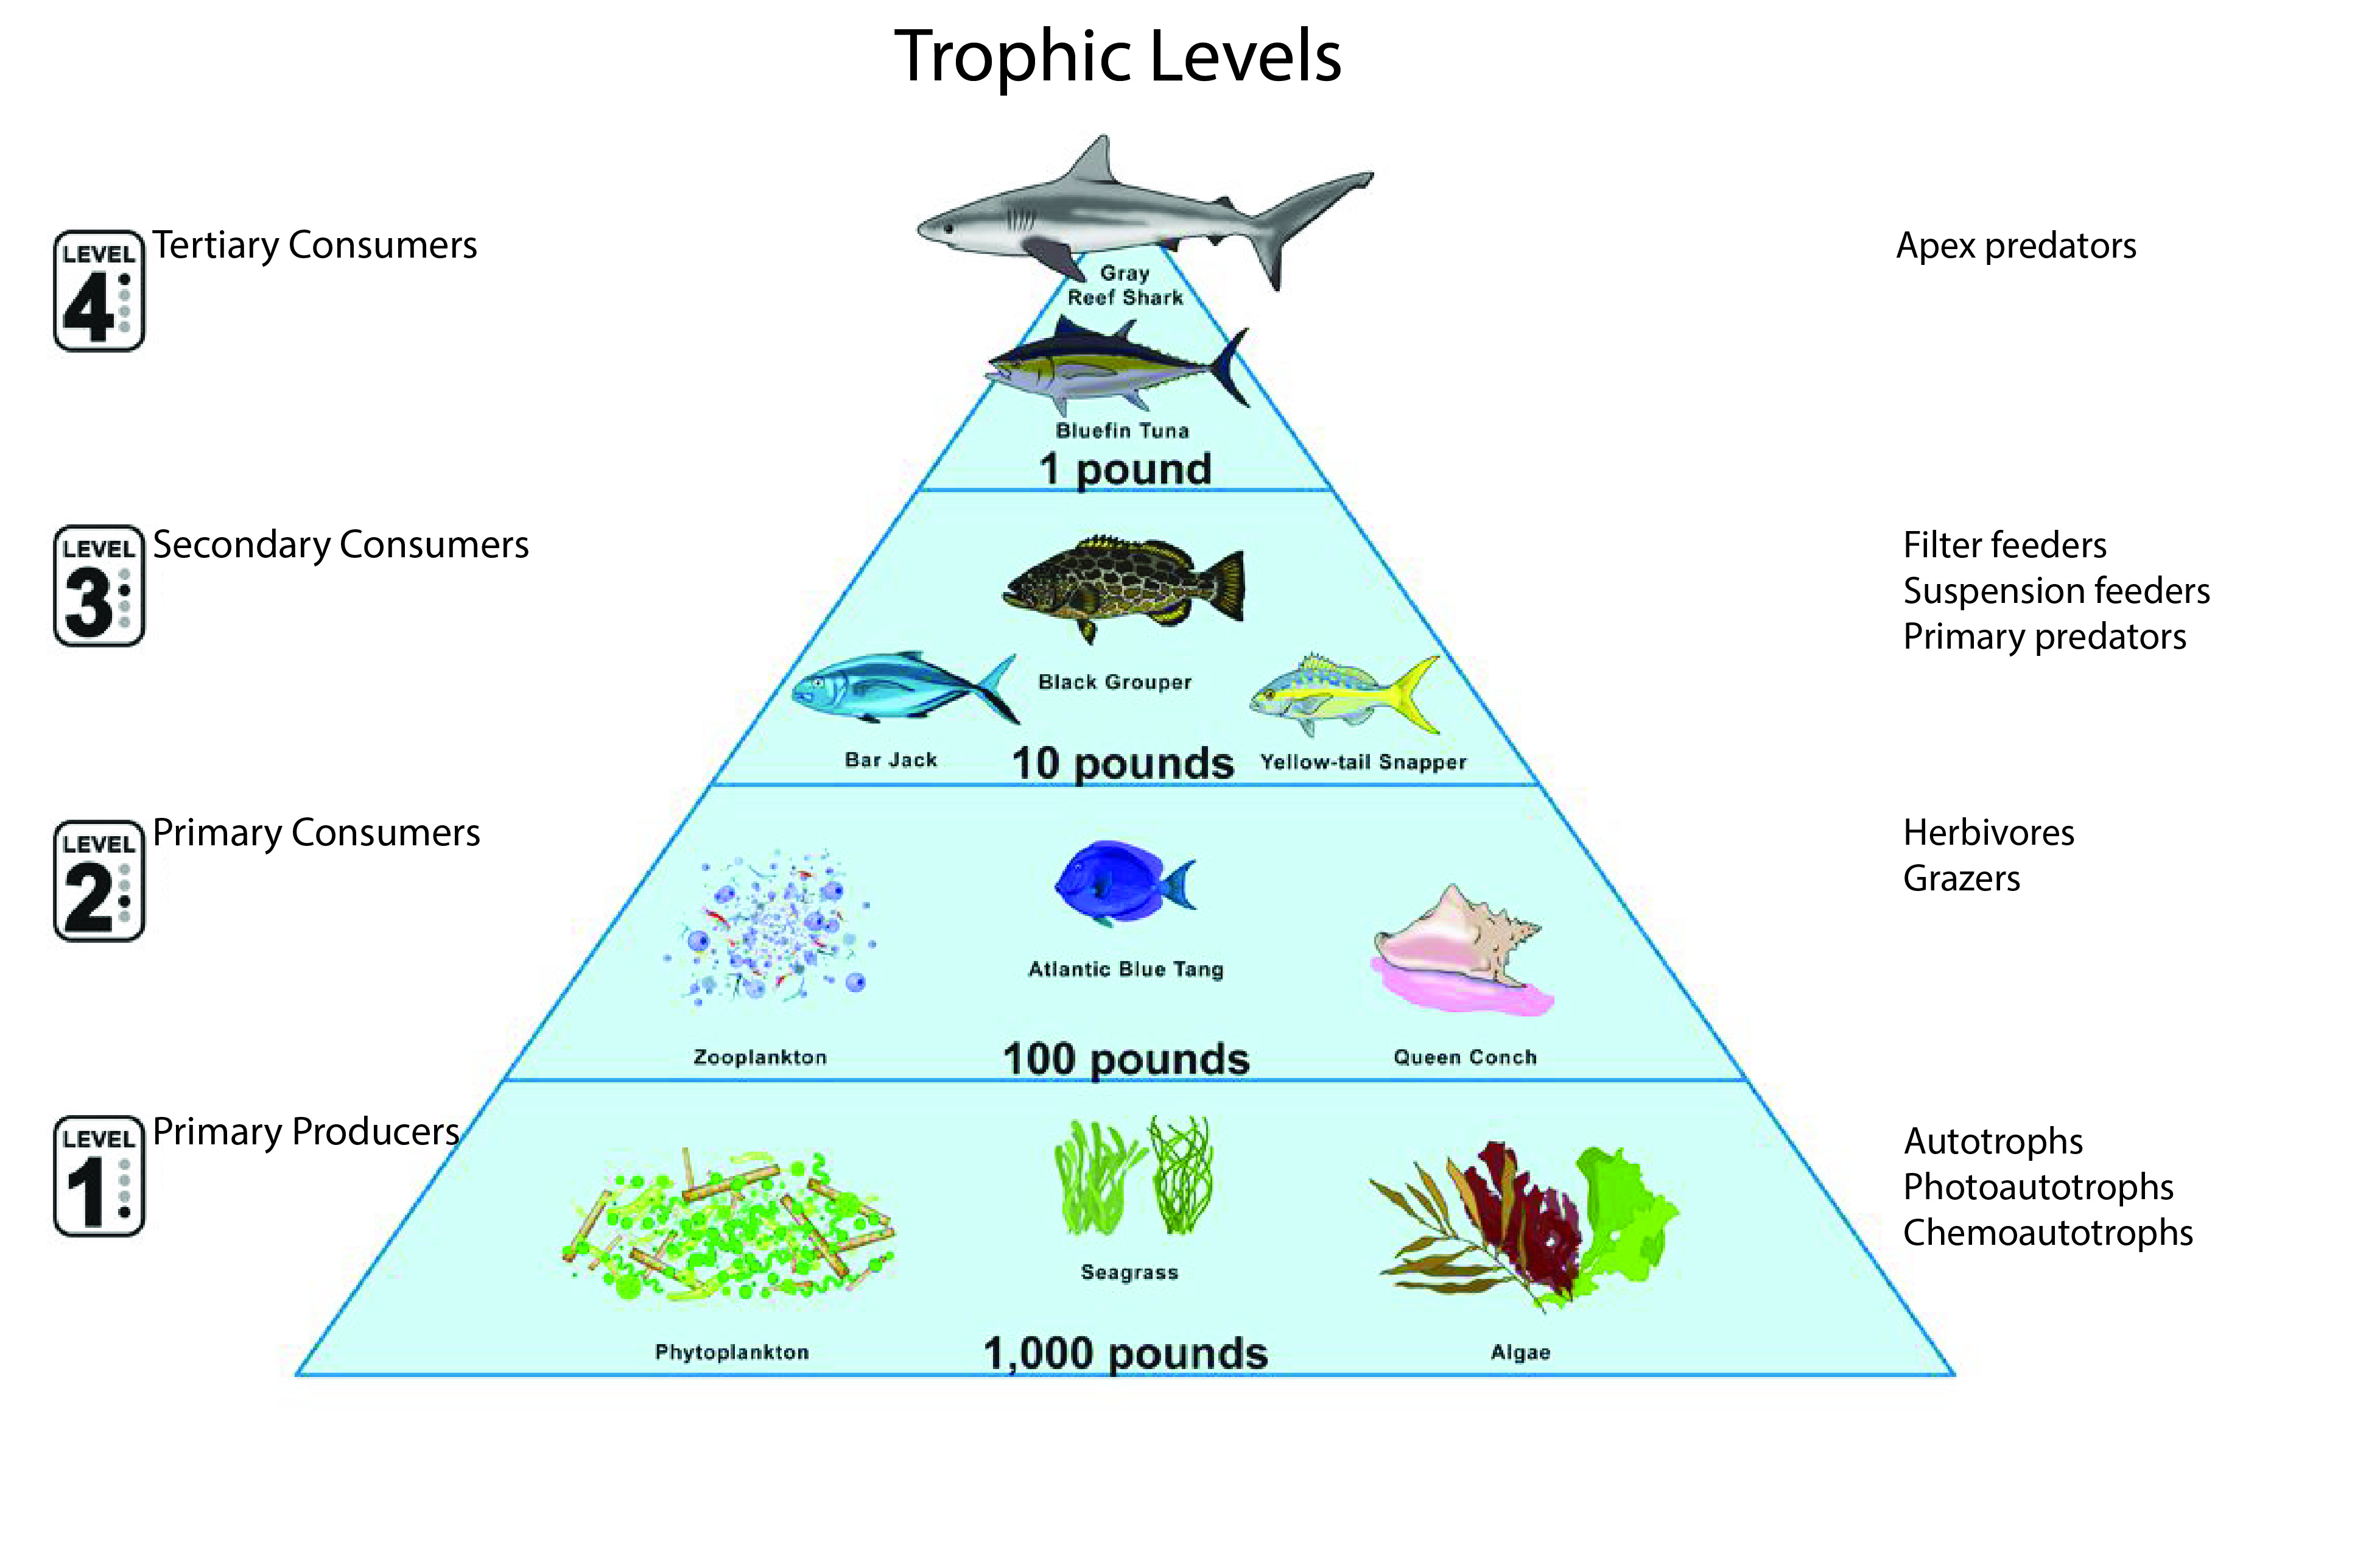
A schematic diagram of trophic levels in the world's oceans.
A classification system for delta deposits in the world.
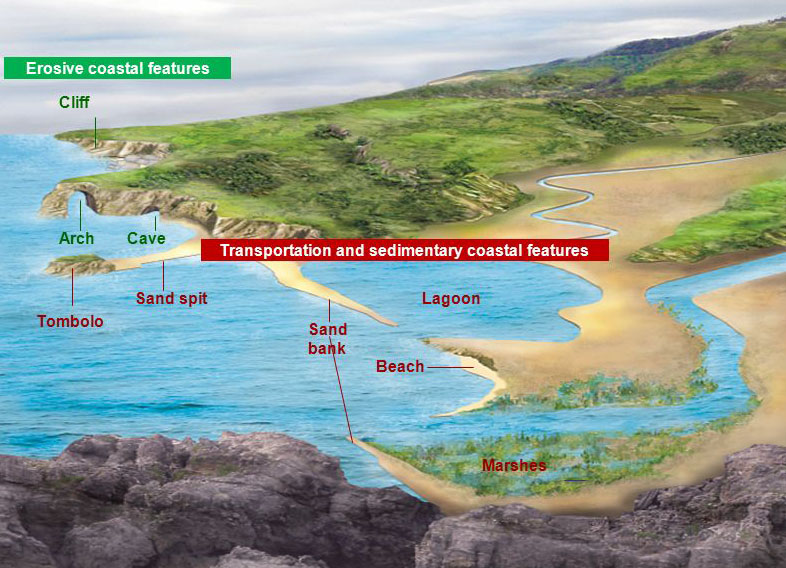
The names of different landforms and features typically found along coasts.
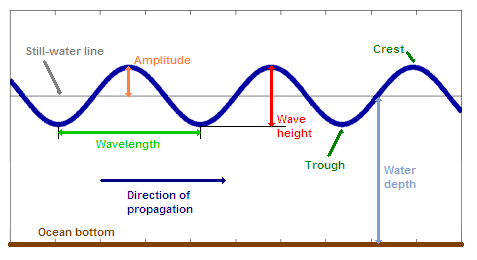
A diagram showing the names for the different parts of the wave.
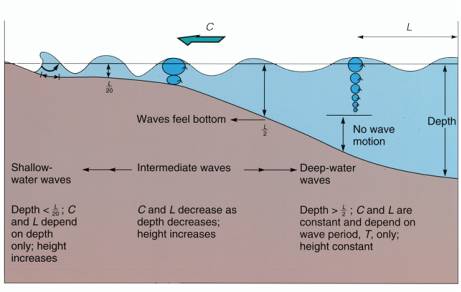
A diagram showing the behavior of waves as they approach shallow waters.

The principal classifications of different wave types.